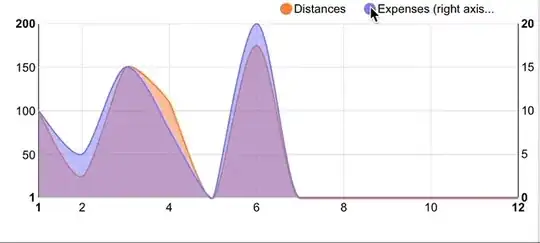
I'm using angular-nvd3 and I'm having a lot of trouble figuring out how to change the way things animate.
Below is what currently happens when you toggle a dataset on. As you can see the Expenses animate in from the upper right and the Distances animate in directly from the right. What I would like them both to do is one of two things. Either animate with a basic fade in, or grow upward.
Here is my controller. Interestingly when I added yDomain1: [1, 200] it caused the Distance chart to animate directly from the right, prior to that it was also animating in from the upper right.
controllers.controller("DashboardController", ['$scope','MileageRestService',
($scope,MileageRestService)->

  $scope.vehicle_log_data = {}

  MileageRestService.dashboard(
    (result)->
      console.log('dashboard result', result)
      $scope.vehicle_log_data = result

      distances = result.current_year.chart_data.distances
      expenses = result.current_year.chart_data.expenses

      $scope.data = [
        {
          key: "Distances",
          color: '#ff7f0e',
          area: true,
          type: "line",
          yAxis: 1,
          values: distances
        },
        {
          key: "Expenses",
          color: '#7777ff',
          area: true,
          type: "line",
          yAxis: 2,
          values: expenses
        }
      ]

      $scope.options = {
        chart: {
          type: 'multiChart',
          height: 256,
          margin : {
            top: 20,
            left: 50
          },
          x: (d)-> d.x,
          y: (d)-> (d.y),
          showValues: true,
          lines1: {
            duration: 500
          },
          lines2: {
            duration: 500
          },
          yDomain1: [1, 200],
          transitions: true,
          useInteractiveGuideline: true,
          clipEdge: false
        }
      }

    (error)->
      console.log('dashboard error', error)
  )
])
The Distance and Expense data is:
distance = [
    {x: 1, y: 100},
    {x: 2, y: 25},
    {x: 3, y: 150},
    {x: 4, y: 110},
    {x: 5, y: 0},
    {x: 6, y: 175},
    {x: 7, y: 0},
    {x: 8, y: 0},
    {x: 9, y: 0},
    {x: 10, y: 0},
    {x: 11, y: 0},
    {x: 12, y: 0}
]

expenses = [
    {x: 1, y: 10},
    {x: 2, y: 5},
    {x: 3, y: 15},
    {x: 4, y: 7.75},
    {x: 5, y: 0},
    {x: 6, y: 20},
    {x: 7, y: 0},
    {x: 8, y: 0},
    {x: 9, y: 0},
    {x: 10, y: 0},
    {x: 11, y: 0},
    {x: 12, y: 0}
]
