I need to work with many hypothesis tests in R and present the results. Here is an example:
> library(MASS)
> h=na.omit(survey$Height)
>
> pop.mean=mean(h)
> h.sample = sample(h,30)
>
> t.test(h.sample,mu=pop.mean)

    One Sample t-test

data:  h.sample
t = -0.0083069, df = 29, p-value = 0.9934
alternative hypothesis: true mean is not equal to 172.3809
95 percent confidence interval:
 168.8718 175.8615
sample estimates:
mean of x
 172.3667
Is there any way that we visualize the t.test or other hypothesis test results?
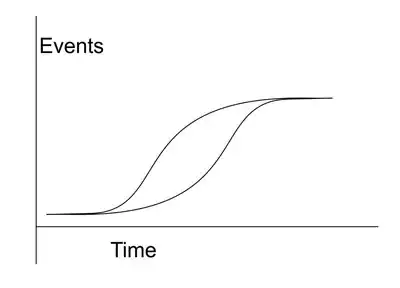
Below is an example of what I am looking for:


