3

I have a project in Visual Studio 2015.

I would like to profile my unit test ( right click on test and profile). However the unit test launches a child process. I would like to profile the child process along with the parent process.

Is there a JetBrains API call to attach the profiler to a child process?

Note that if I profile an application I have the opportunity to profile child processes.

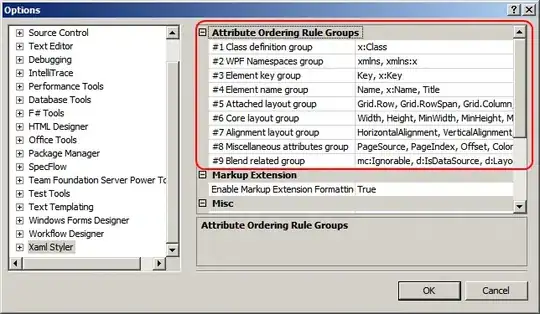
enter image description here

but with unit test profiling this option is not available
enter image description here

bradgonesurfing
  • 30,949
  • 17
  • 114
  • 217

2 Answers2

0

Here's how I worked around this limitation.

My Setup: Visual Studio 2015, Nunit

  1. Install the Nunit console runner
  2. In Visual Studio: Compile your test assembly (e.g. MyTests.dll)
  3. Create a batch file to execute the nunit console.

Batch File Content Example:

@echo off
nunit3-console.exe /out:results.xml "{PathToYourProjectRoot}\bin\debug\MyTests.dll"
  1. Open the "Run Application Performance Profiling..."
  2. Select standalone applicaiton
  3. Choose the batch file.
  4. Tick the advanced checkbox.
  5. Tick the "profile child processes" check box.
  6. Start the profiler session.
Cr1spy
  • 241
  • 1
  • 5
0

Just for information: starting from dotTrace 2017.2 "Profile child processes" checkbox is available for unit tests profiling, so there is no need to use the workaround described by Cr1spy.

KonKat
  • 296
  • 1
  • 5