I have a number of 2d probability mass functions from 2 categories. I am trying to plot the contours to visualise them (for example at their half height, but doesn't really matter).
I don't want to use contourf to plot directly because I want to control the fill colour and opacity. So I am using contourc to generate xy coordinates, and am then using fill with these xy coordinates.
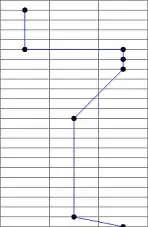
The problem is that the xy coordinates from the contourc function have strange numbers in them which cause the following strange vertices to be plotted.
At first I thought it was the odd contourmatrix format, but I don't think it is this as I am only asking for one value from contourc. For example...
contourmatrix = contourc(x, y, Z, [val, val]);
h = fill(contourmatrix(1,:), contourmatrix(2,:), 'r');
Does anyone know why the contourmatrix has these odd values in them when I am only asking for one contour?
UPDATE:
My problem seems might be a failure mode of contourc when the input 2D matrix is not 'smooth'. My source data is a large set of (x,y) points. Then I create a 2D matrix with some hist2d function. But when this is noisy the problem is exaggerated...

But when I use a 2d kernel density function to result in a much smoother 2D function, the problem is lessened...

The full process is
a) I have a set of (x,y) points which form samples from a distribution
b) I convert this into a 2D pmf
c) create a contourmatrix using contourc
d) plot using fill


