0

Is it possible to have an exponential scale of an axis with TDBChart (instead of a logarithmic scale)?

A logarithmic scale of the y-axis is useful, when the graph corresponds to an exponential growth. As the following example shows, the y-axis values of the graph between 0 and 1 are extra highlighted while indiviual outliers beyond that will become more and more unimportant:

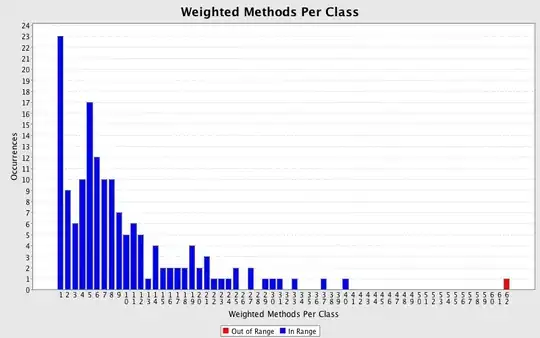
However, if there is somekind of an inverse behavior of a graph compared to above example, where small values aren't very important (noise) but indiviual outliers should be made explicitly visible, then an exponential scale is useful:

So, is it possible to scale an axis with TDBChart exponentially?

Tom Brunberg
  • 20,312
  • 8
  • 37
  • 54
DRASIT
  • 13
  • 3
  • http://stackoverflow.com/help/how-to-ask – Prasad Mar 05 '16 at 14:32
  • Note exponential is the inverse of logarithmic. If the logarithmic property on the axis doesn't give the result you'd expect, please arrange an [sscce](http://sscce.org/) – Yeray Mar 07 '16 at 11:38
  • @Yeray: Yes, I'm aware about the connection between exponential and logarithmic scales. The question is not about mathematical basics. In TDBChart there is a build-in option to have an logarithmic scale. I'd like to know whether it is possible to manipulate an axis in TDBChart to have an exponential (in general arbitrary) scale or if it would be necessary to change the source code of TDBChart to achieve that. – DRASIT Mar 07 '16 at 22:18

1 Answers1

2

The following code populates a series with exponential data:

uses Series, Math;

procedure TForm1.FormCreate(Sender: TObject);
var i: Integer;
begin
  Chart1.View3D:=False;
  Chart1.Legend.Visible:=false;

  with Chart1.AddSeries(TLineSeries) as TLineSeries do
  begin
    Pointer.Visible:=true;
    Pointer.Size:=2;

    for i := 1 to 10 do
      Add(Power(2, i));
  end;
end;

The result looks as follows:

exponential growth


Then, if you add the following code to the above:

  Chart1.Axes.Left.Logarithmic:=true;

Now the data is still the same but the left axis scale changes to a logarithmic scale:

logarithmic scale


You can also change the labels format, ie:

  Chart1.Axes.Left.AxisValuesFormat:='00e-0';
  Chart1.Axes.Left.LabelsExponent:=true;

exponential labels


Edit:

Setting a logarithmic base of 1.544 on TeeChart and custom labels to show those labels in your screenshot:

uses Series, Math;

procedure TForm1.FormCreate(Sender: TObject);
var i: Integer;
begin
  Chart1.View3D:=False;
  Chart1.Legend.Visible:=false;

  with Chart1.AddSeries(TLineSeries) as TLineSeries do
  begin
    Pointer.Visible:=true;
    Pointer.Size:=2;

    for i := 1 to 7 do
      Add(Power(2, i));
  end;

  with Chart1.Axes.Left do
  begin
    Logarithmic:=True;
    LogarithmicBase:=1.544;
    MinorTicks.Visible:=false;

    with Items do
    begin
      Clear;
      Add(0.1, '0.1');
      Add(1.2, '1.2');
      Add(1.5, '1.5');
      Add(2, '2');
      Add(3, '3');
      Add(5, '5');
      Add(7, '7');
      Add(10, '10');
      Add(15, '15');
      Add(20, '20');
      Add(30, '30');
      Add(40, '40');
      Add(50, '50');
      Add(70, '70');
      Add(100, '100');

      SetMinMax(0.1, 100);
    end;
  end;
end;

It looks like this:

LogarithmicBase 1.544

The distance between 0.1 and 1.2 is much greater than in your screenshot, and I'm not sure if that's a bug or if that's mathematically correct.
I can change the axis scale to start at 1 instead of 0.1 to make it look much similar to your screenshot but I'm not sure if that would be what you want:

      SetMinMax(1, 100);

Axis Minimum 1)

Yeray
  • 5,009
  • 1
  • 13
  • 25
  • Thanks! But this is not what I need. (I'd need something like `Chart1.Axes.Left.Exponential:=true;`) I've added additional details to the question above. – DRASIT Mar 08 '16 at 21:21
  • Thank you for your help! Actually, I was wrong. The second example isn't an exponential scale. It is logarithmic but only starting with 1.2! The graph between 0.1 and 1.2 is squeezed together. Indeed, very strange. – DRASIT Mar 09 '16 at 23:09