1

I am using National Instrument to do data acquisition and show the collected data on charts. However, the curve has a sharp tip when I zoom in the curve as shown on the image: enter image description here

I am using the following code to get this chart:

  private void timer9_Tick(object sender, EventArgs e)
    {
        Task analogInTask1 = new Task();
        AIChannel myAIChannel1;

        myAIChannel1 = analogInTask1.AIChannels.CreateVoltageChannel(
            "dev1/AI1",
            "myAIChannel1",
            AITerminalConfiguration.Rse,
            0,
            5,
            AIVoltageUnits.Volts
            );

        AnalogSingleChannelReader reader1 = new AnalogSingleChannelReader(analogInTask1.Stream);
        double analogDataIn1 = reader1.ReadSingleSample();
        tension1Reading.Text = analogDataIn1.ToString("f2");


        DataPoint dp0 = new DataPoint(x, analogDataIn1);
        chart2.Series[0].Points.RemoveAt(0);
        chart2.Series[0].Points.Add(dp0);
        x++;

        if (checkBox1.Checked == true)
            chart2.Series["Series1"].Enabled = true;
        else
            chart2.Series["Series1"].Enabled = false;

    }

I am using a tension sensor to collect data so that I can show them on graph. Is that the problem of x axis not matched with y axis. Since I am using [x++;] to count the x axis while I use analog data Input to get Y axis. How can I get a straight or smooth line?
Wai Ka
  • 43
  • 7

2 Answers2

3

Have you tried a moving average? That can be tailored to however you want and will appear to "smooth" out the graph. Here's a very simple sample of how to amend your code with that.

// get the last 4 points to average out (plus analogDataIn1)
int pointsToAverage = 4;
int pointCount = chart2.Series[0].Points.Count();
var buffer = chart2.Series[0].Points.Skip(Math.Max(0, pointCount - pointsToAverage)).Select(dp => dp.YValues[0]);
// calculate the average Y from these points (along with analogDataIn1)
double avgAnalogDataIn1;
if (buffer.Count() == 0)
{
    avgAnalogDataIn1 = analogDataIn1;
}
else
{
    avgAnalogDataIn1 = (buffer.Sum() + analogDataIn1) / (double)(buffer.Count() + 1);
}

DataPoint dp0 = new DataPoint(x, avgAnalogDataIn1);
chart2.Series[0].Points.RemoveAt(0);
chart2.Series[0].Points.Add(dp0);
x++;

This example uses 5 points to average on. You can quickly increase the number of points to average on by bumping up the pointsToAverage to, say, 10 and that will make the graph even smoother. Note that the lines will still have 'sharp tips' - there is no ChartType that smooths the lines for you.

Balah
  • 2,530
  • 2
  • 16
  • 24
  • thz so much. I tried your sample. But I get 1 error that stop me from testing: 'DataPoint' does not contain a definition for 'Y' and no extension method 'Y' accepting a first argument of type 'DataPoint' could be found (are you missing a using directive or an assembly reference?) – Wai Ka Mar 03 '16 at 03:52
  • I forgot that to get the Y value for the existing data points, it comes from `YValues`. I've changed the code. – Balah Mar 03 '16 at 06:25
  • Thz so so much. It can run now. But the curve still have those sharp tips – Wai Ka Mar 03 '16 at 07:32
  • I am using a tension sensor to collect data so that I can show them on graph. Is that the problem of chart x axis not matched with y axis. Since I am using [x++;] to count the x axis while I use analog data IN to get Y axis. – Wai Ka Mar 03 '16 at 07:39
  • As long as your tension sensor is collecting data at regular intervals, `x++` is just fine. The problem is the chart - there isn't a `ChartType` that automatically smooths those sharp tips. You either have to find a different chart, create your own "smooth" function - http://stackoverflow.com/questions/4388911/how-can-i-draw-smoothed-rounded-curved-line-graphs-c - or average out the points (like in my answer) – Balah Mar 03 '16 at 09:58
  • I tried different ways to average out the points but it has no effect on smoothing the curve or cancel the noise. It only delays the cure movement. Do you know anything like a low pass filter which can filter out the noise while keeping my sensor signal? – Wai Ka Apr 01 '16 at 01:53
  • Can you post an example of what you are expecting to see? (as well as post what this answer is doing for you). There isn't a really an easy way of doing it on a discrete source without resorting to a time-based fourier transforms - way out of scope for this. See http://www.lomont.org/Software/Misc/FFT/LomontFFT.html for an example implementation. – Balah Apr 11 '16 at 15:26
1

As a variant of Balah's answer:

To create a moving average you can simply make use of one of the powerful built-in statistical functions:

chart1.DataManipulator.FinancialFormula(FinancialFormula.MovingAverage, 
                                       "15", "S1:Y1", "S2:Y");

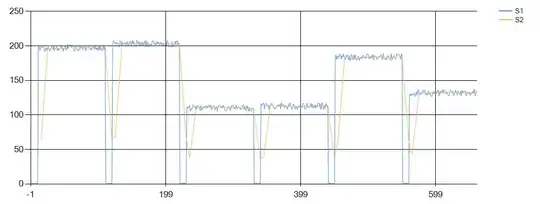
This will smooth a Series S1 over 15 points and draw the result into a Series S2:

enter image description here

Note that finding the right range to do the average over depends mainly on your data and your requirements. In my example there are artifacts created when the range spans one of the gaps..

TaW
  • 53,122
  • 8
  • 69
  • 111
  • I have tried to add your code to my function, but the chart collapsed when I run the function. I am still trying to find the error, is it the input series name wrong? – Wai Ka Apr 01 '16 at 01:23
  • Well, as I wrote it was wriiten and tested with a `Series S1`. If your input Series is 'Series1' and your output Series `Series2` change it to `..."15", "Series1:Y1", "Series2:Y"` ! Make sure to create the output series before running the command! – TaW Apr 01 '16 at 03:13