I can think of a way to do it, but:
- I don't know if it's the "right" way.
- It's only good for static images (i.e. if you zoom/pan the plot, the bounds won't change accordingly).
The idea is you create two more axes and specify their positions such that they're far enough from your data, then hide the original axes (either fully or partially), which gives the desired result:
%% // Create axes and plot something:
figure();
hA(1) = axes;
hA(2) = copyobj(hA(1),gcf);
hA(3) = copyobj(hA(1),gcf);
plot(hA(1),rand(1,40));
%% // Add the new axes:
%// Move them around
FRACTION_OF_POSITION = 0.6;
hA(2).Position(1) = FRACTION_OF_POSITION*hA(2).Position(1);
hA(3).Position(2) = FRACTION_OF_POSITION*hA(3).Position(2);
%// Change their style
hA(2).Color = 'none'; hA(3).Color = 'none';
hA(2).XTick = []; hA(3).YTick = [];
hA(2).XRuler.Axle.Visible = 'off';
hA(3).YRuler.Axle.Visible = 'off';
%% // Remove the box/ticks/labels of the original axes:
if true
%// Alternative 1 (Remove everything at once, including background):
  set(hA(1),'Visible','off')
else
%// Alternative 2 (Remove only certain elements):
  hA(1).Box = 'off';
  hA(1).XRuler.Axle.Visible = 'off';
  hA(1).YRuler.Axle.Visible = 'off';
end
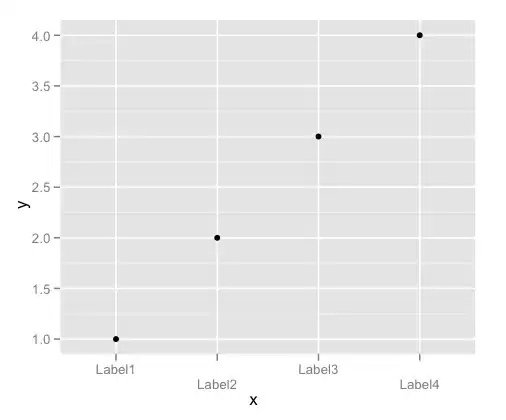
Which results in:
Additional considerations:
- If you
copyobj the axes before plotting, the axis tick values would be default - you probably don't want that. You will have to set the ticks and labels manually, OR, copyobj after plotting but then delete the line child-objects of hA(2:3).
- If you want to support zoom/pan behavior, this might be acheivable using
linkaxes.
Credits: the idea to use .XRuler.Axle was taken from Dan here, who in turn took it from UndocumentedMatlab.
 ]
]