1

I want to draw three lines for three values on time chart on xy-axis. from this helpful page How to adjust the xand y axis line in jfreecharts I can draw a one line for one value on time chart, so my question is that how can I draw three lines on time chart?

Notice that drawing three line is reduced to drawing a two line, so if you can draw a two-line, then you're able to answer this question, I just want to find the key role here in this code that draws one line in order to add another line.

In one way to do that I tried to put the following this.series.add(new Millisecond(), this.lastValue2);on actionPerformed() and define a new dataset but this doesn't help.

this is the code that is taken from previous link [1].

public class DynamicLineAndTimeSeriesChart extends ApplicationFrame implements ActionListener {

/** The time series data. */
private TimeSeries series;

/** The most recent value added. */
private double lastValue = 100.0;

/** Timer to refresh graph after every 1/4th of a second */
private Timer timer = new Timer((1000), this);//1/4th = 250 ms, to put 1 minute then = 1000*60. 1 second = 1000 ms, 1/4 secon = 250 ms
private double lastValue2 = 1.0;
/**
 * Constructs a new dynamic chart application.
 *
 * @param title  the frame title.
 */
public DynamicLineAndTimeSeriesChart(final String title) {

    super(title);
    this.series = new TimeSeries("Random Data", Millisecond.class);

    final TimeSeriesCollection dataset = new TimeSeriesCollection(this.series);

    final JFreeChart chart = createChart(dataset, dataset);

    timer.setInitialDelay(1000);

    //Sets background color of chart
    chart.setBackgroundPaint(Color.LIGHT_GRAY);

    //Created JPanel to show graph on screen
    final JPanel content = new JPanel(new BorderLayout());

    //Created Chartpanel for chart area
    final ChartPanel chartPanel = new ChartPanel(chart);

    //Added chartpanel to main panel
    content.add(chartPanel);

    //Sets the size of whole window (JPanel)
    chartPanel.setPreferredSize(new java.awt.Dimension(800, 500));

    //Puts the whole content on a Frame
    setContentPane(content);

    timer.start();

}

/**
 * Creates a sample chart.
 *
 * @param dataset  the dataset.
 *
 * @return A sample chart.
 */
private JFreeChart createChart(final XYDataset dataset, final XYDataset dataset2) 
{
    final JFreeChart result = ChartFactory.createTimeSeriesChart("Dynamic Line And TimeSeries Chart",
        "Time (every 2 minutes)",
        "Value of binary bits",
        dataset,
        true,
        true,
        false
    );
//        
//        final JFreeChart result2 = ChartFactory.createTimeSeriesChart("Dynamic Line And TimeSeries Chart",
//            "Time (every 2 minutes)",
//            "Value of binary bits",
//            dataset,
//            true,
//            true,
//            false
 //        );
//        


    final XYPlot plot = result.getXYPlot();
//        final XYPlot plot2 = result2.getXYPlot();

//        plot2.setBackgroundPaint(Color.BLACK);
//        plot2.setDomainGridlinesVisible(true);
//        

    plot.setBackgroundPaint(new Color(0xffffe0));
    plot.setDomainGridlinesVisible(true);
    plot.setDomainGridlinePaint(Color.lightGray);
    plot.setRangeGridlinesVisible(true);
    plot.setRangeGridlinePaint(Color.lightGray);

    ValueAxis xaxis = plot.getDomainAxis();

    xaxis.setAutoRange(true);

    //Domain axis would show data of 60 seconds for a time
    xaxis.setFixedAutoRange((1*60.0*1000.0));  // 60 seconds = 1 minutes, 60*60.0*1000.0= 1 hour of graph
    xaxis.setVerticalTickLabels(true);

    ValueAxis yaxis = plot.getRangeAxis();
    yaxis.setRange(0.0, 300.0);

//        ValueAxis xaxis2 = plot2.getDomainAxis();

//        xaxis2.setAutoRange(true);
//
//        //Domain axis would show data of 60 seconds for a time
//        xaxis2.setFixedAutoRange((1*60.0*1000.0));  // 60 seconds = 1 minutes, 60*60.0*1000.0= 1 hour of graph
//        xaxis2.setVerticalTickLabels(true);

    ValueAxis yaxis2 = plot.getRangeAxis();
    yaxis2.setRange(0.0, 1000.0);

    return result;
}

public void actionPerformed(final ActionEvent e) {

    final double factor = 0.9 + 0.2*Math.random();
    this.lastValue = this.lastValue * factor;

    this.lastValue2 = Math.random();
   // final Millisecond now = new Millisecond();
    this.series.add(new Millisecond(), this.lastValue);

   // System.out.println("Current Time in Milliseconds = " + now.toString()+", Current Value : "+this.lastValue);
}
}
Community
  • 1
  • 1
user777
  • 139
  • 6
  • What did you tried? This is the same code of the question you quotes ... – Bruno Ribeiro Jan 10 '16 at 16:03
  • @BrunoCésar Hi, thank you for your comment, the way to resolve this problem, I'm right now studying this code and its branches, but the difficult is that I don't know how actionPerformed() was being called since there is no call function, so it makes the program difficult to read or to modify, therefore I'm looking for someone who knows how to deal with JFreechart library, if I don't find any, then I'm right know doing test for each statement of the code to find how it works exactly. I will right on the code the explanation of some lines of the code, so this is what I'm doing right now. – user777 Jan 10 '16 at 17:03

1 Answers1

3

Ok, apparently you don't tried anything, by changing the sample, for example. Even so I'll try help you, by simply changing "your" sample, so I don't show all code, just the alterated parts.

First of all you'll need three datasets, since makes no sense plot the same dataset three times:

private final TimeSeries series;
private final TimeSeries secondSeries;
private final TimeSeries thirdSeries;

And in the constructor will look like this:

series = new TimeSeries("Random Data 1");
secondSeries = new TimeSeries("Random Data 2");
thirdSeries = new TimeSeries("Random Data 3");

To simplify datasets creation I'll adopt this:

private XYDataset createDataset(final TimeSeries series) {
    return new TimeSeriesCollection(series);
}

I put original time series in a method, just to organize the source:

private void firstTimeSeries(final XYPlot plot) {
    final ValueAxis xaxis = plot.getDomainAxis();
    xaxis.setAutoRange(true);

    // Domain axis would show data of 60 seconds for a time
    xaxis.setFixedAutoRange(60000.0); // 60 seconds
    xaxis.setVerticalTickLabels(true);

    final ValueAxis yaxis = plot.getRangeAxis();
    yaxis.setRange(0.0, 300.0);

    final XYItemRenderer renderer = plot.getRenderer();
    renderer.setSeriesPaint(0, Color.RED);

    final NumberAxis yAxis1 = (NumberAxis) plot.getRangeAxis();
    yAxis1.setTickLabelPaint(Color.RED);
}

The "xaxis" and "yaxis" can be the same, we need only of different renderer to the new datasets, something like this:

private void secondTimeSeries(final XYPlot plot) {
    final XYDataset secondDataset = this.createDataset(secondSeries);
    plot.setDataset(1, secondDataset); // the second dataset (datasets are zero-based numbering)
    plot.mapDatasetToDomainAxis(1, 0); // same axis, different dataset
    plot.mapDatasetToRangeAxis(1, 0); // same axis, different dataset

    final XYItemRenderer renderer = new XYLineAndShapeRenderer(true, false);
    renderer.setSeriesPaint(0, Color.BLUE);
    plot.setRenderer(1, renderer);
}

private void thirdTimeSeries(final XYPlot plot) {
    final XYDataset thirdDataset = this.createDataset(thirdSeries);
    plot.setDataset(2, thirdDataset); // the third dataset (datasets are zero-based numbering)
    plot.mapDatasetToDomainAxis(2, 0); // same axis, different dataset
    plot.mapDatasetToRangeAxis(2, 0); // same axis, different dataset

    final XYItemRenderer renderer = new XYLineAndShapeRenderer(true, false);
    renderer.setSeriesPaint(0, Color.GREEN);
    plot.setRenderer(2, renderer);
}

createChart method now look like this:

private JFreeChart createChart() {
    final XYDataset dataset = this.createDataset(series);
    final JFreeChart result = ChartFactory.createTimeSeriesChart("Dynamic Line And TimeSeries Chart", "Time", "Value", dataset, true, true, false);

    final XYPlot plot = result.getXYPlot();
    plot.setBackgroundPaint(new Color(0xffffe0));
    plot.setDomainGridlinesVisible(true);
    plot.setDomainGridlinePaint(Color.LIGHT_GRAY);
    plot.setRangeGridlinesVisible(true);
    plot.setRangeGridlinePaint(Color.LIGHT_GRAY);

    // first time series
    this.firstTimeSeries(plot);

    // second time series
    this.secondTimeSeries(plot);

    // third time series
    this.thirdTimeSeries(plot);

    return result;
}

As you can see I changed createChart, now it have no argument, so change this in DynamicLineAndTimeSeriesChart.

Lastly, now we have three datasets, so we need to generate three last values, like this:

@Override
public void actionPerformed(final ActionEvent e) {
    final double factor = 0.9 + 0.2 * Math.random();
    lastValue = this.generateValue(lastValue, factor);
    series.add(new Millisecond(), lastValue);

    final double factor2 = 0.9 + 0.2 * Math.random();
    lastValue2 = this.generateValue(lastValue2, factor2);
    secondSeries.add(new Millisecond(), lastValue2);

    final double factor3 = 0.9 + 0.2 * Math.random();
    lastValue3 = this.generateValue(lastValue3, factor3);
    thirdSeries.add(new Millisecond(), lastValue3);
}

To adjust generated values, use this:

private double generateValue(final double lastValue, final double factor) {
    final double result = lastValue * factor;
    if (result <= 0.0 || result >= 300.0) {
        return 100.00;
    }
    return result;
}

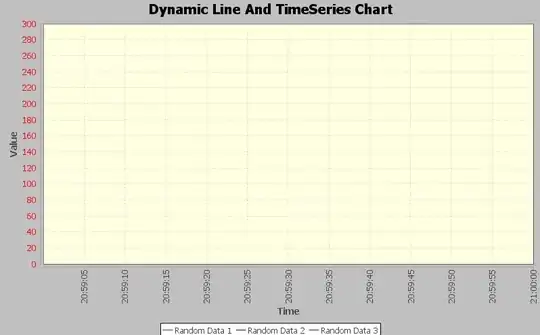
This is an example of modified example running:

As you can see this is a fixed sample to generate the chart, you can change the sample to generate in a dynamic way.

Bruno Ribeiro
  • 5,956
  • 5
  • 39
  • 48
  • Thank you so much Bruno, I didn't think it takes a lot of changes, one simple question, when I want to put on the y-axis a specific value for Random Data 2, then I go to secondTimeSeries() and I put: ValueAxis yaxis = plot.getRangeAxis(); yaxis.setRange(0.0, 10.0); but this doesn't work, Is there a way to do that? in very few words, can I have the same x-axis but different y-axis and at the same time keep them on one chart? – user777 Jan 10 '16 at 19:46
  • @user777 you need a constant value to second series, is that? If so, just change value generation, always add `lastValue2` without changes. If not, consider open another question with more detail – Bruno Ribeiro Jan 10 '16 at 20:04