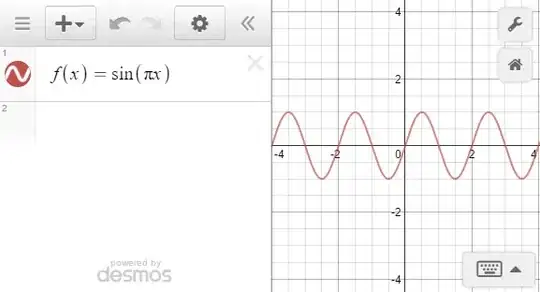
I am wanting to replicate the equation plotting functionality provided by the Desmos Graphing Calulator, and other graphing tools, such as Wolfram Alpha, and MatLab. I am planning on using WebGL to plot the equations.
This simple sine equation I am quite comfortable in dealing with, as there is 1 y-axis value for every x-axis value i.e. it passes the vertical line test. I can iterate through each x-axis pixel on the screen, and evaluate the function and obtain the relevant y-axis value, giving me a set of points to draw a line from. I'm not sure if this is the most optimal way, but it certainly works.
However with this square wave, if I were to evaluate at the points x = 0,1,2,3 etc, I would only get a single corresponding y-value. How can I draw this function?
As another example, how would I draw a circle that only provides this implicit equation?
I'm not looking to use a graphing library, nor am I interested in how to ONLY draw these 3 shapes. I'm more interested in how the libraries themselves provide a generic math function drawing capabilities that is able to draw any equation that is provided to them.


