2

UPDATE: My question is the opposite of this one, which it's been suggested might be a duplicate. I want not to use interpolation.

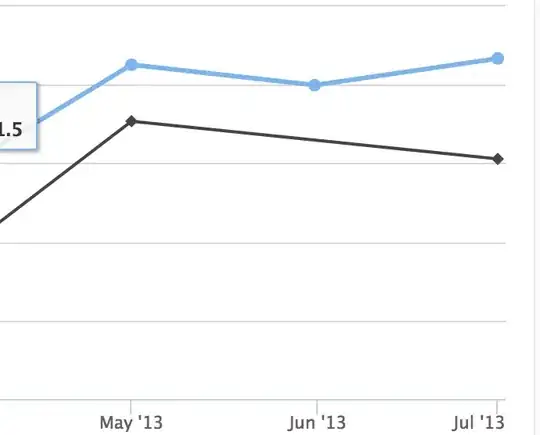
I am using Highcharts 4.1.7. I have a line chart with two time series. One series has a missing (not null, missing) data point.

By default in Highcharts, the line chart joins the points on either side and ignores the missing value. Is there any way to tell Highcharts not to join points where they are missing a value present in the other series?

I know that I can manually insert null values (and the default setting of connectNulls: false will do the rest), but it seems odd that Highcharts would interpolate between missing values by default - it's definitely visually misleading.

Code:

$('#container').highcharts({
    xAxis: {
        type: 'datetime',
        dateTimeLabelFormats: {
            month: '%b \'%y'
        }
    },
    series: [{
        data: [{ x: 1362096000000, y: 29.9}, { x: 1364774400000, y: 71.5}, { x: 1367366400000, y: 106.4}, { x: 1370001600000, y: 99.9}, { x: 1372636800000, y: 108.4}]
    },
    {
        data: [{ x: 1362096000000, y: 19.9}, { x: 1364774400000, y: 44.5}, { x: 1367366400000, y: 88.4}, { x: 1372636800000, y: 76.4}]
    }]
});

JSFiddle here: http://jsfiddle.net/rnshabuf/

Renders like this:
enter image description here

Community
  • 1
  • 1
Richard
  • 62,943
  • 126
  • 334
  • 542
  • 3
    Adding `null` values is the appropriate way to go. This seems to be the default behaviour of HighCharts, and imo, it is fine the way it is. It is a line chart. Imagine you had two or three points missing. You would have scattered lines over the chart, which doesn't seem to represent anything visually either. – Serendipity Nov 25 '15 at 11:08
  • 3
    This is the reason why it works this way: Two series are independent. So there is no way for Highcharts to know where to draw the line and where not. I don't think it is clever to build the second line based on the first X-values. – lvil Nov 25 '15 at 11:21
  • Possible duplicate of [Highcharts: Displaying Linechart with missing datapoints](http://stackoverflow.com/questions/13029368/highcharts-displaying-linechart-with-missing-datapoints) – J-D Nov 25 '15 at 13:21
  • See my comment below - with two series there is a way to know what's missing. The default rendering is misleading. – Richard Nov 25 '15 at 16:57
  • 1
    1) a second series only determines whether the two series match or not. Maybe they're both "missing" data. Maybe they're both supposed to contain irregularly occurring data points. How would the chart possibly know? – jlbriggs Nov 25 '15 at 19:25
  • 1
    2) the default behavior is plotting what it was instructed to plot. It can't know whether your particular data set is misrepresented by doing so. You need to specify what it should plot and how. The concept of "missing" data is one that you need to figure out and properly format your data and plot options to handle. – jlbriggs Nov 25 '15 at 19:26

1 Answers1

2

The chart has no way of knowing what you consider "missing".

There are any number of reasons that a data set may have very valid gaps of any size between points - not all data occurs at regular intervals.

You need to pre-process your data and fill in what's missing according to the definition of your specific data, and how you want to handle it (how missing values should be treated in a time series is a wide topic with a lot of varied opinions).

jlbriggs
  • 17,612
  • 4
  • 35
  • 56
  • With two series, there is a way to know what's missing. Almost any behaviour would be better than the default interpolation. – Richard Nov 25 '15 at 16:57
  • 2
    I'm sorry, but that is incorrect. The only way to know what's missing is to specifically define what is expected. A second series does not accomplish that. The default behavior is the correct behavior for a charting engine - it is plotting what you told it to, and there are plenty of valid examples of why it should plot irregular data in exactly the way that it is. If it isn't plotting what you want, you haven't instructed it properly. Preprocess your data so it knows what you want it to do. – jlbriggs Nov 25 '15 at 19:22