In Python 2.6, I used matplotlib to make some simple graphs. However, it is incompatible with Python 3.1.
What are some alternative modules that can accomplish the same thing without being very complex?
In Python 2.6, I used matplotlib to make some simple graphs. However, it is incompatible with Python 3.1.
What are some alternative modules that can accomplish the same thing without being very complex?
You say you want to create some simple graphs but haven't really said how simple or what sort of graphs you want. So long as they aren't too complex you might want to consider using the Google Chart API.
e.g. 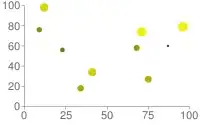
That has some advantages: you just have to construct a URL that describes the desired chart so there shouldn't be any issues using it from Python 3.x. Of course there are disadvantages also: you need to have an internet connection when generating the chart, and you might not have the chart styles you have been using with matplotlib.
If you don't want to construct the URLs directly there is at least one Python wrapper for the charts API. It doesn't work directly on Python 3.x, but running it through 2to3 seems to convert it successfully.
A stable version supporting Python 3 has since been released: official announcement.
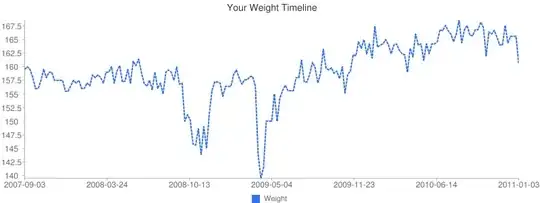
I wrote a small example that runs in python 3 and uses the google chart api (as suggested by Duncan, I wrote the solution after seeing this post).
It is not ideal since it adds a dependency one a 3rd party that might break backward compatibility at any time, but the graphs are nice and there is absolutely no added dependency on the python code. Worth considering for not 'mission critical code'.
You can find/download the example here. Here is the graph that it generates from data in a .xml file:
# build the query with template parameters
query ="http://chart.apis.google.com/chart?chxl=0:__X_LABELS__&chxp=__X_LABELS_POS__&chxr=0,__MIN_TIME__,__MAX_TIME__|1,__MIN_WEIGHT__,__MAX_WEIGHT__&chxs=0,676767,11.5,0,lt,676767|1,676767,11.5,0,lt,676767&chxt=x,y&chs=800x300&cht=lc&chco=3072F3&chds=__MIN_WEIGHT__,__MAX_WEIGHT__&chd=t:__COMMASEP_WEIGHT__&chdl=Weight&chdlp=b&chls=2,4,1&chma=5,5,5,25&chtt=Your+Weight+Timeline"

[...]

# relace template with data
query = query.replace('__X_LABELS__', strXLabels)
query = query.replace('__X_LABELS_POS__', strXLabelsPos)
query = query.replace('__MIN_TIME__', str(min(lst_dateEpoch)))
query = query.replace('__MAX_TIME__', str(max(lst_dateEpoch)))

[...]

# use 'urllib.request' to download the data & write to file
sock = urllib.request.urlopen(query)
image_bytes = sock.read()
sock.close()

fh = open('Weight_GoogleGraphApi.png', 'wb')
fh.write(image_bytes)
fh.close()
Matplotlib binaries for python 3.x (windows) are avaliable. http://www.lfd.uci.edu/~gohlke/pythonlibs/
As an alternative to installing subversion to grab the source, Numpy's SF files page has the latest copy of 1.5 in a few different (Windows-friendly) formats:
rpy2 is providing access to the graphics capabilities of R, and rpy2 is becoming compatible with Python 3 (thanks to the help of Google for funding Greg over the summer).
Code against the current dev branch is in a patch queue.
edit: rpy2 2.2.0 is working with Python 3.2
There are at least two graphing libraries using PyQt, namely PyQwt and PyQtGraph. I've been using PyQwt with Python 2.6 for a few weeks now and it is quite handy. The documentation isn't great, and most of the time I need to refer to either the Qwt docs or the examples - although the times I've had to look at the docs have been few and far between, it is VERY easy to use. I tried building it against python 3.1 just now though without success. I coulnd't find the tar package for 5.2.1 which is the only version compatible with python 3.0 and there isn't anything on MacPorts for that either.
There is also a fairly complete looking list of plotting libraries on at python.org http://wiki.python.org/moin/NumericAndScientific/Plotting