I would like to create a simple descriptive tree diagram from a data frame with minimal manual work.
It could look like this:
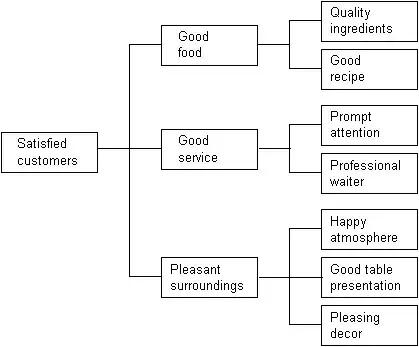
But it would need to have sample size in each of the boxes.
I am after the following functionality:
- Generate the plot based on a data frame (rather than the more manual options shown here)
- Ability to change the order of branches (e.g. sex/agegroup/status vs. status/sex/agegroup)
- Add labels to each branch
- Provide summary statistics for branch (e.g. male\n=200 female\n=300) either counts, or perhaps total length of stay up that that point in the tree.
I found this tread (here) that uses the ape-package that can do phylogenetic tree, which are close to what I am after.
Here is an example using the 'lung' dataset
lung$status <- factor(lung$status)
lung$sex <- factor(lung$sex)
lung$ph.ecog <- factor(lung$ph.ecog)
lung$Age[lung$age >60]<- "60+"; lung$Age[lung$age <=60]<- "<60"
lung$Age <- factor(lung$Age)


library(ape)
newdata <- as.phylo(x=~sex/Age/status/ph.ecog,data=lung)
plot.phylo(x=newdata,show.tip.label=TRUE,show.node.label=TRUE,no.margin=TRUE, root.edge=T)
This is giving close to what I want (although I am not interested in the final nodes, which are patients). It meets criteria 1 & 2, but not 3 and 4. The help of plot.phylo points towards show.node.label() that might fix requirement 3, but I cannot get this to work. Have not found any example that helps with the 4th functionality requirement.