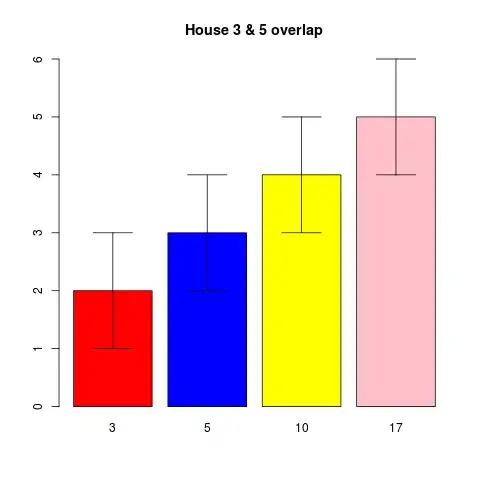
I'm trying to make a barplot2 of a dataset (which is too long to upload) with 4 different colors. The problem is, only 3/4 are colored it skips the first bar. I've searched on Google to check whether I've written it correct or not, but it should be correct. I've also tried to write the colors in numbers instead of names like
col = 3:4:5:6
But I got the same result, it skips the first bar.
What I've tried: I've looked here on Stackoverflow before asking the question, but I didn't find a solution for my problem, moreover I've also tried Google. As my dataset is too long, I'm only gonna upload the relevant code, which I expect that you prefer :)
## Barplot
library(gplots)
CIA <- t.test(tmp3)$conf.int
CIB <- t.test(tmp5)$conf.int
CIC <- t.test(tmp10)$conf.int
CID <- t.test(tmp17)$conf.int
lower <- c(CIA[1], CIB[1], CIC[1], CID[1])
upper <- c(CIA[2], CIB[2], CIC[2], CID[2])

## install.packages( pkgs= "gplots")

barplot2(c(mean3, mean5, mean10, mean17),
plot.ci = TRUE, ci.l = lower, ci.u = upper,
col = c("red", "blue", "yellow", "pink"),
main ="House 3 & 5 overlap", ylim= c(0,6),
names = c("3","5","10","17"))
Result:

EDIT: Without na's:


