6

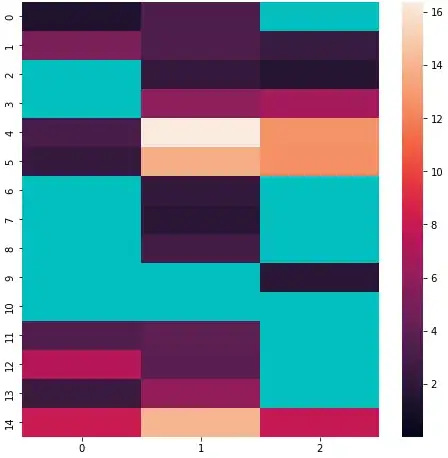
I'm trying to create a heatmap in seaborn (python) with certain squares colored with a different color, (these squares contain insignificant data - in my case it will be squares with values less than 1.3, which is -log of p-values >0.05). I couldn't find such function. Masking these squares also didn't work. Here is my code:

import matplotlib.pyplot as plt
import numpy as np
import matplotlib as mpl
import seaborn as sns; sns.set()
data = [[1.3531363408, 3.339479161, 0.0760855365], [5.1167382617, 3.2890920405, 2.4764601828], [0.0025058257, 2.3165128345, 1.6532714962], [0.2600549869, 5.8427407219, 6.6627226609], [3.0828581725, 16.3825494439, 12.6722666929], [2.3386307357, 13.7275065772, 12.5760972276], [1.224683813, 2.2213656372, 0.6300876451], [0.4163788387, 1.8128374089, 0.0013106046], [0.0277592882, 2.9286203949, 0.810978992], [0.0086613622, 0.6181261247, 1.8287878837], [1.0174519889, 0.2621290291, 0.1922637697], [3.4687429571, 4.0061981716, 0.5507951444], [7.4201304939, 3.881457516, 0.1294141768], [2.5227546319, 6.0526491816, 0.3814362442], [8.147538027, 14.0975727815, 7.9755706939]]
cmap2 = mpl.colors.ListedColormap(sns.cubehelix_palette(n_colors=20, start=0, rot=0.4, gamma=1, hue=0.8, light=0.85, dark=0.15, reverse=False))
ax = sns.heatmap(data, cmap=cmap2, vmin=0)
plt.show()

I want to add that I'm not very advanced programmer.
Fabio Lamanna
  • 20,504
  • 24
  • 90
  • 122
Ilona
  • 446
  • 4
  • 12
  • [This question](http://stackoverflow.com/questions/31707033/change-certain-squares-in-a-seaborn-heatmap) is specifically about the annotations, but the basic approach will be similar to your issue. – mwaskom Oct 14 '15 at 15:15
  • By the way you can just say `as_cmap=True` in `cubehelix_palette`; you don't need to make the colormap object yourself. – mwaskom Oct 14 '15 at 15:15
  • Indeed that link was useful. – Ilona Oct 15 '15 at 09:23

1 Answers1

13

OK, so I can answer my question myself now :) Here is the code that solved the problem:

import matplotlib.pyplot as plt
import numpy as np
import matplotlib as mpl
import seaborn as sns; sns.set()

data = np.array([[1.3531363408, 3.339479161, 0.0760855365],
                 [5.1167382617, 3.2890920405, 2.4764601828],
                 [0.0025058257, 2.3165128345, 1.6532714962],
                 [0.2600549869, 5.8427407219, 6.6627226609],
                 [3.0828581725, 16.3825494439, 12.6722666929],
                 [2.3386307357, 13.7275065772, 12.5760972276],
                 [1.224683813, 2.2213656372, 0.6300876451],
                 [0.4163788387, 1.8128374089, 0.0013106046],
                 [0.0277592882, 2.9286203949, 0.810978992],
                 [0.0086613622, 0.6181261247, 1.8287878837],
                 [1.0174519889, 0.2621290291, 0.1922637697],
                 [3.4687429571, 4.0061981716, 0.5507951444],
                 [7.4201304939, 3.881457516, 0.1294141768],
                 [2.5227546319, 6.0526491816, 0.3814362442],
                 [8.147538027, 14.0975727815, 7.9755706939]])
cmap1 = mpl.colors.ListedColormap(['c'])

fig, ax = plt.subplots(figsize=(8, 8))
sns.heatmap(data, ax=ax)
sns.heatmap(data, mask=data > 1.3, cmap=cmap1, cbar=False, ax=ax)
plt.show()

enter image description here

So the problem with masking which didn't work before was that it works only on arrays not on lists. And another thing is just plotting the heatmap twice -second time with masking. The only thing I still don't understand is that it masks opposite fields from what is written.. I want to mask values below 1.3, but then it colored values above 1.3.. So I wrote mask=data >1.3 and now it works...

Trenton McKinney
  • 56,955
  • 33
  • 144
  • 158
Ilona
  • 446
  • 4
  • 12