0

I have create a time series matrix with code and output like below:

ts2 <-ts(cbind(LRC_3PDMUM, LRC_3PDMMS),frequency=12,start=c(2012,1))
ts2
         LRC_3PDMUM LRC_3PDMMS
Jan 2012   0.029256   0.025904
Feb 2012   0.051945   0.055827
Mar 2012   0.078153   0.084049
Apr 2012   0.100596   0.110188
May 2012   0.126015   0.136850
Jun 2012   0.149349   0.162446
Jul 2012   0.173949   0.186486
Aug 2012   0.198704   0.212683
Sep 2012   0.220277   0.237433
Oct 2012   0.244358   0.262342
Nov 2012   0.272664   0.286019
Dec 2012   0.293653   0.309429
Jan 2013   0.320472   0.331575
Feb 2013   0.339880   0.356900
Mar 2013   0.362203   0.384612
Apr 2013   0.383525   0.408996
May 2013   0.403316   0.431810
Jun 2013   0.430651   0.454040
Jul 2013   0.453148   0.475161
Aug 2013   0.484378   0.496460
Sep 2013   0.501923   0.518307
Oct 2013   0.525252   0.541631
Nov 2013   0.544958   0.563007
Dec 2013   0.564571   0.582775

However, when I do plot(ts2), the plot has x-axis value like 2012.0, 2013.0, versus what I would expect Jan 2012, feb 2013, etc. Please advise how to revise the code. Thanks!
MatthewD
  • 6,719
  • 5
  • 22
  • 41

1 Answers1

0

Assuming an example that looks like yours:

a <- ts( matrix(1:100,ncol=2), frequency = 12, start = c(1959, 1))

> a
         Series 1 Series 2
Jan 1959        1       51
Feb 1959        2       52
Mar 1959        3       53
Apr 1959        4       54
May 1959        5       55
Jun 1959        6       56
Jul 1959        7       57
Aug 1959        8       58
Sep 1959        9       59
Oct 1959       10       60
Nov 1959       11       61
Dec 1959       12       62
Jan 1960       13       63
Feb 1960       14       64
#and so on...

The easiest way would be to use the xts package like this:

library(xts)
#transform to xts that uses this date format
b <- as.xts(a)
#plot first series
plot (b[, 'Series 1'], ylim=c(0,100))
#plot second series
lines(b[, 'Series 2'], col='red')

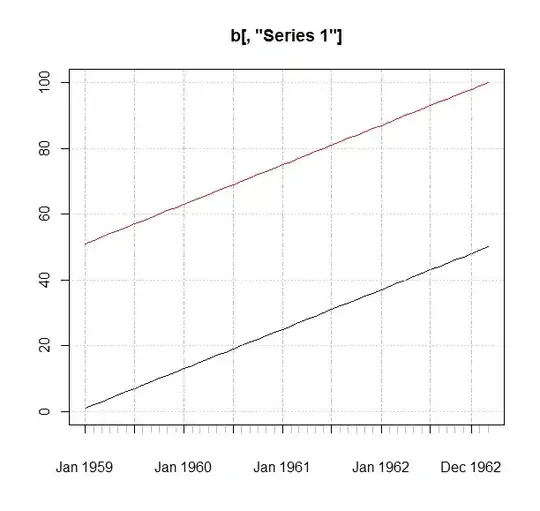
enter image description here

LyzandeR
  • 37,047
  • 12
  • 77
  • 87