1

I was given a memory dump to analyze for High CPU usage of a service which is running on Windows 2008 R2 (Client machine). The dump was taken using task manager.

I tried using the symbols which were available with us on the dump which was provided to me (The dump was taken using task manager), but no success. Later, I found that the dump taken from task manager was not working hence I took the dump of the service on my system using Windbg. I was able to load the symbols.

But, I was in need of the dump files from client machine. When I tried to take the dump of the service when it was consuming around 85% of CPU by attaching it to Windbg, to my surprise the CPU consumption suddenly dropped to 0%.

Obviously I need the dump from the client machine to analyze whats happening and why the service is consuming 85% of CPU.

Not getting how to take the dump using Windbg, as soon as I attach the service by pressing F6, the CPU consumption drops to 0%.
NJMR
  • 1,886
  • 1
  • 27
  • 46

2 Answers2

6

When you attach with windbg all the threads are suspended in your service until you issue the g command. That's why your service's CPU consumption goes to zero. But that's OK because you have a snapshot of what all your threads were doing when CPU consumption was at 85%. The ~*kb command will show you that. Then issue g, notice that CPU consumption goes back up. When it's high enough, break in (Debug | Break) and then run ~*kb again to see what the threads were doing. Repeat multiple times and you should see a pattern. Also, use !runaway each time to easily see the busiest threads.

Marc Sherman
  • 2,303
  • 14
  • 22
5

Instead of using dumps, use ETW to capture a trace of the CPU usage. ETW traces contain a sum of the calls and not snapshots like you have in dumps. To capture a trace, install the Windows Performance Toolkit from the Windows SDK, open a command prompt as admin and run this to capture the CPU usage:

xperf -on latency -stackwalk profile -buffersize 2048 -MaxFile 2048 -FileMode Circular && timeout -1 && xperf -d C:\HighCPUUsage.etl

After you finished capturing the trace, open it by doing a double click on the ETL file. Now setup debug symbols and load them.

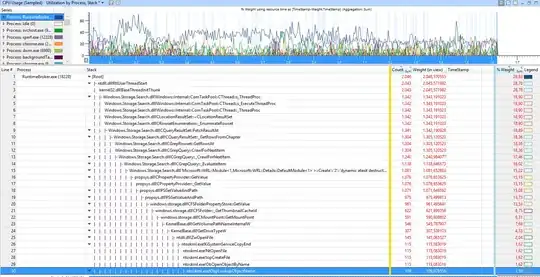
Now drag&drop the CPU usage (Sampling) graph to the analyze pane and select "utilization by Process, Stack"

enter image description here

Now expand the stack of your service to see which functions are called:

enter image description here

Microsoft explained this here in a Video.

magicandre1981
  • 27,895
  • 5
  • 86
  • 127