Actually, this is the expected behaviour of lab.z. I quote from the documentation:
lab
a numerical vector of the form c(x, y, len). The values of x and y give the (approximate) number of tickmarks on the x and y axes.
lab.z
the same as lab, but for z axis.
As you see above it clearly says that the number of ticks is always approximate and not accurate.
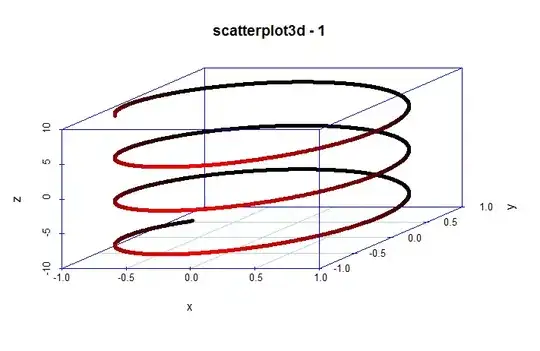
You will notice this behaviour (the same behaviour you see in your plot) in the examples section of scatterplot3d below:
z <- seq(-10, 10, 0.01)
x <- cos(z)
y <- sin(z)
scatterplot3d(x, y, z, highlight.3d=TRUE, col.axis="blue",
              col.grid="lightblue", main="scatterplot3d - 1", pch=20,
             lab.z=1)
This produces 3 ticks:

Then the graph's ticks change again when lab.z=3 (lab.z=2 produces the same number of ticks as the above).
> scatterplot3d(x, y, z, highlight.3d=TRUE, col.axis="blue",
               col.grid="lightblue", main="scatterplot3d - 1", pch=20,
              lab.z=3)
As you can see this produces 5 ticks and the number stays the same for values of lab.z between 3~7. You will see the same behaviour for values between 8~12. So, my point is that this is expected.


