0

I am new to NVD3 libraries. I am trying to use the cumulative line chart but unable to render the y axis. I have two series, Input and Output.. with x showing the date while y showing the values from 50 - 400 range. However I am able to render the xaxis but not able to get the yaxis rendered. Please help.

My code is as below.

<script src="https://cdnjs.cloudflare.com/ajax/libs/d3/3.4.11/d3.min.js"></script>
nv.addGraph(function() {
      var chart = nv.models.cumulativeLineChart()
        .x(function(d) { return d.x })
        .y(function(d) { return d.y })
        .color(d3.scale.category10().range())
        .useInteractiveGuideline(true);

      chart.forceY([0]);
      chart.xScale(d3.time.scale());
      
      chart.xAxis
        .tickFormat(function(d) {
          return d3.time.format('%x')(new Date(d));
        });
      
      var format = ',f';
          
          chart.yAxis
              .axisLabel(' ')
              .tickFormat(d3.format(format));

      d3.select('#recordChartDiv svg')
        .datum(data)
        .transition().duration(500)
        .call(chart);

      nv.utils.windowResize(chart.update);
      return chart;
    });

Json data

However I am getting below output with incorrect yaxis. output with incorrect yaxis
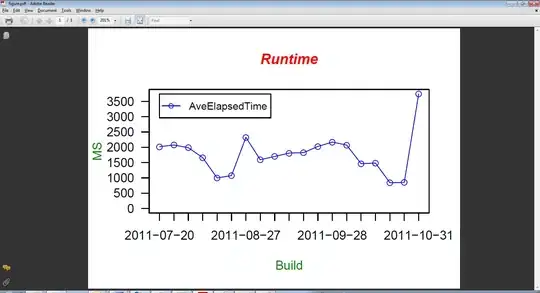
Can someone pls guide me ?

TrexTroy
  • 303
  • 7
  • 22
  • Similar problem. http://jsfiddle.net/apasiali/1thf2sbs/ Please check yaxis value and actual values of y. – TrexTroy Sep 18 '15 at 03:19
  • Does setting your range in forceY help? right now your code shows it as forceY([0]) how about changing it to forceY([50,400]) ? – hunters30 Sep 18 '15 at 03:24

1 Answers1

0

Please give this a try. Hope it helps :

var chart = nv.models.cumulativeLineChart()
                .x(function(d) { return d.x })
                .y(function(d) { return d.y })
                .color(d3.scale.category10().range())
                .useInteractiveGuideline(true)
                .forceY([50,400]);

In this case it ensure that your y-Axis will show values from 50-400 however if you have values out of that range axis adjust and those values will still show up.However if you try something as such:

chart.yAxis.scale().domain([0, maxValue]);

This will correctly set your axis, however if any values are out of range they will not show up in your chart.

Take a look at Live Code Example here : Example

try appending forceY([50,400]); by making code like this :

var chart = nv.models.lineChart()
.useInteractiveGuideline(true)
.forceY([50,400])
;

Hope you now have a clear sense of how to proceed.

Edit :: I finally managed to find out what was happening. Nothing seems wrong with your code. Problem seems to be specific to cumulativeLineChart() it was made with intention of being index chart one user mentioned. If you wish to go into details here it is : Bug

So not sure if that was made intentionally that way or not. Any way if you just change it to lineChart() instead your code will work fine. I have updated your fiddle. Take a look here now : Working example

hunters30
  • 501
  • 3
  • 21
  • forceY accepts array basically of any size not just two values and ensure those values are always part of your axis. At the same time values out of this range won't be directly eliminated if your plot itself has such values. – hunters30 Sep 18 '15 at 03:29
  • Thanks for the reply. I am still having the same issue. it basically increase the range but value itself is somehow render differently. When i actually try to see the value for formatting purpose using this. It shows me that the values is getting manipulated. chart.yAxis.tickFormat(function(d){return d}); – TrexTroy Sep 18 '15 at 03:49
  • @TrexTroy yep please see edit for that. Change to lineChart. Your code isnt wrong . Just do not use cumulativeLineChart – hunters30 Sep 18 '15 at 03:52