4

Question

In R, I would like to create n variables of length L which relationship is given by a correlation matrix called cor_matrix. The important point is that the n variables may follow different distributions (including continuous vs discrete distributions).

Related posts

  1. how-to-generate-sample-data-with-exact-moments

  2. generate-a-random-variable-with-a-defined-correlation-to-an-existing-variable

  3. r-constructing-correlated-variables

Modified from the third post listed above, the following is a solution whenever all n variables are continuous and come from the same distribution.

library(psych) 

set.seed(199)

fun = function(cor_matrix, list_distributions, L)
{
    n = length(list_distributions)
    if (ncol(cor_matrix) != nrow(cor_matrix)) stop("cor_matrix is not square")
    if (nrow(cor_matrix) != n) stop("the length of list_distributions should match the number of columns and rows of cor_matrix")
    if (L<=1) stop("L should be > 1")

    fit = principal(cor_matrix, nfactors=n, rotate="none")
    loadings = matrix(fit$loadings[1:n, 1:n], nrow=n,ncol=n,byrow=F)
    cases = t(sapply(1:n, FUN=function(i, L) list_distributions[[i]](L), L=L))
    multivar = loadings %*% cases
    T_multivar = t(multivar)
    vars=as.data.frame(T_multivar)
    return(vars)
}

L = 1000
cor_matrix =  matrix(c (1.00, 0.90, 0.20 ,
                     0.90, 1.00, 0.40 ,
                     0.20, 0.40, 1.00), 
                  nrow=3,ncol=3,byrow=TRUE)

list_distributions = list(function(L)rnorm(L,0,2), function(L)rnorm(L,10,10), function(L) rnorm(L,0,1))
vars = fun(cor_matrix, list_distributions, L)
cor(vars)
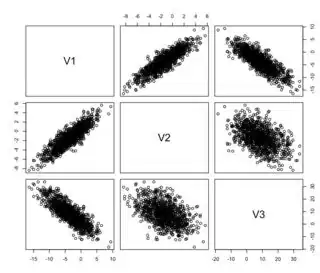
plot(vars)

enter image description here

However, one cannot create correlated variables with the following distributions

list_distributions = list(function(L)rnorm(L,0,2), function(L)round(rnorm(L,10,10)), function(L) runif(L,0,1))
vars = fun(cor_matrix, list_distributions, L)
cor(vars)
plot(vars)
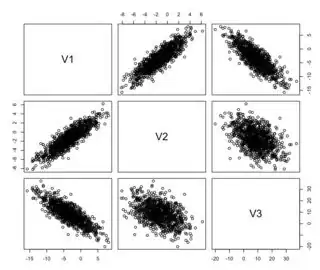
enter image description here

Community
  • 1
  • 1
Remi.b
  • 17,389
  • 28
  • 87
  • 168

1 Answers1

3

Using copulas as suggested by @NatePope and @JoshO'Brien

library(mvtnorm)

set.seed(199)

fun = function(cor_matrix, list_distributions, L)
{
    n = length(list_distributions)
    # Correlated Gaussian variables
    Gauss = rmvnorm(n=L, mean = rep(0,n), sig=cor_matrix)
    # convert them to uniform distribution.
    Unif = pnorm(Gauss) 
    # Convert them to whatever I want
    vars = sapply(1:n, FUN = function(i) list_distributions[[i]](Unif[,i]))
    return(vars)
}

L = 2000
cor_matrix =  matrix(c (1.00, 0.90, 0.80 ,
                     0.90, 1.00, 0.6,
                     0.80, 0.6, 1.00), 
                  nrow=3,ncol=3,byrow=TRUE)

list_distributions = list(function(L) qpois(L,7), function(L) round(qnorm(L,100,10)), function(L) qnorm(L,-100,1))

vars = fun(cor_matrix, list_distributions, L)
cor(vars)
plot(as.data.frame(vars))

enter image description here

This solution has the default of creating correlated normally distributed variables to transform them to uniformly distributed variables afterward. There is probably a more performant solution that would directly create uniformly distributed correlated variables.

Remi.b
  • 17,389
  • 28
  • 87
  • 168
  • 1
    I suppose one could use some multivariate generalization of the beta ... for example the generalized Dirichlet has a fairly general correlation structure. But really, it's hard to beat the interpretability and flexibility of the multivariate Gaussian, and the procedure you outline is not too computationally demanding unless the dimensionality is high. – Nate Pope Sep 03 '15 at 21:53