1

I've added two series: Series1 (CandeleStick), Series2 (Line). I've added points and the FinancialFormula:

 public Form1() {
            InitializeComponent();
            chart1.Series[0].Points.Add(24.00, 25.00, 25.00, 24.875);
            chart1.Series[0].Points.Add(23.625, 25.125, 24.00, 24.875);
            chart1.Series[0].Points.Add(26.25, 28.25, 26.75, 27.00);
            chart1.Series[0].Points.Add(26.50, 27.875, 26.875, 27.25);
            chart1.Series[0].Points.Add(26.375, 27.50, 27.375, 26.75);
            chart1.Series[0].Points.Add(25.75, 26.875, 26.75, 26.00);
            chart1.Series[0].Points.Add(25.75, 26.75, 26.125, 26.25);
            chart1.Series[0].Points.Add(25.75, 26.375, 26.375, 25.875);
            chart1.Series[0].Points.Add(24.875, 26.125, 26.00, 25.375);
            chart1.Series[0].Points.Add(25.125, 26.00, 25.625, 25.75);
            chart1.Series[0].Points.Add(25.875, 26.625, 26.125, 26.375);
            chart1.Series[0].Points.Add(26.25, 27.375, 26.25, 27.25);
            chart1.Series[0].Points.Add(26.875, 27.25, 27.125, 26.875);
            chart1.Series[0].Points.Add(26.375, 27.125, 27.00, 27.125);
            chart1.Series[0].Points.Add(26.75, 27.875, 26.875, 27.75);
            chart1.Series[0].Points.Add(26.75, 28.375, 27.50, 27.00);
            chart1.Series[0].Points.Add(26.875, 28.125, 27.00, 28.00);
            chart1.Series[0].Points.Add(26.25, 27.875, 27.75, 27.625);
            chart1.Series[0].Points.Add(27.50, 28.75, 27.75, 28.00);
            chart1.Series[0].Points.Add(25.75, 28.25, 28.00, 27.25);
            chart1.Series[0].Points.Add(26.375, 27.50, 27.50, 26.875);
            chart1.Series[0].Points.Add(25.75, 27.50, 26.375, 26.25);
            chart1.Series[0].Points.Add(24.75, 27.00, 26.50, 25.25);
            chart1.DataManipulator.IsStartFromFirst = true;
            chart1.DataManipulator.FinancialFormula(FinancialFormula.TripleExponentialMovingAverage, "5", "Series1:Y4", "Series2:Y");
        }

But I can't get the expected result. Just line on zero level. What I'm doing wrong?
Eugene Maksimov
  • 1,504
  • 17
  • 36

1 Answers1

1

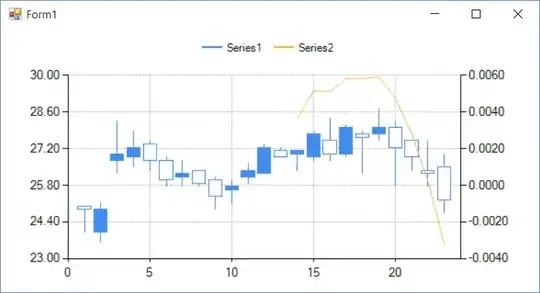
Your data is actually there. You need to adjust Minimum and Maximum for your axis scale and also the axis used for each series: AxisY or AxisY2.

enter image description here

EDIT: For the sake of testing, if you just repeat your own price pattern:

enter image description here

jsanalytics
  • 13,058
  • 4
  • 22
  • 43
  • But the TEMA indicator is just smoothing (http://www.metatrader5.com/en/terminal/help/analytics/indicators/trend_indicators/tema) Why result values are so small? – Eugene Maksimov Sep 03 '15 at 07:14
  • "Triple Exponential Moving Average Formula (Chart Controls) Useful for eliminating short and insignificant cycles in the data. It smoothes the data three times using the Exponential Moving Average Formula, and then calculates the rate of change in the moving average based on the result for the previous day." (https://msdn.microsoft.com/en-us/library/vstudio/dd489223(v=vs.100).aspx) - It is not TEMA it is Trix indicator. – Eugene Maksimov Sep 03 '15 at 07:48
  • The chart from MSDN example (https://msdn.microsoft.com/en-us/library/vstudio/dd456747%28v=vs.100%29.aspx) shows TEMA between -0.005 and +0.015, consistent with your results here. Also, you have only 23 sample points and a period of 5. You need a larger sample. Note also that towards the end of the chart, TEMA is already trying to follow the price declining. So it looks correct to me, given limited input provided to the financial formula. – jsanalytics Sep 03 '15 at 10:46
  • I edited my answer. Please take a look. If you just repeat your price pattern, for the sake of testing, you can see better what TEMA does. – jsanalytics Sep 03 '15 at 11:16
  • Do you have any follow-up questions on this? Please give it the green check mark if it answered your question. Thank you. – jsanalytics Sep 04 '15 at 01:49
  • Actually the TEMA indicator is not shown it the example. In the example the TRiX indicator is shown (despite of it's name). – Eugene Maksimov Sep 09 '15 at 14:41
  • Ok, TRiX indicator.... but did my post solve the problem you're having with the chart not showing the data? – jsanalytics Sep 09 '15 at 14:43
  • Please accept my answer as described here: [How does accepting an answer work](http://meta.stackexchange.com/questions/5234/how-does-accepting-an-answer-work). – jsanalytics Sep 09 '15 at 15:02