1

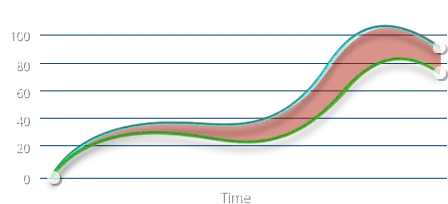
In my d3.js line graph, i would like to fill a color between 2 of lines. and i need to add a boll on the start of the graph and end of the graph too. any one suggest me the correct way to do this?

here is the image, that what i am trying to make :

Live graph sample

Live demo here

my js code :

function InitChart() {

    var vis = d3.select("#visualisation"),
      WIDTH = 1000,
      HEIGHT = 500,
      MARGINS = {
        top: 20,
        right: 20,
        bottom: 20,
        left: 50
      },
      xScale = d3.scale.linear().range([MARGINS.left, WIDTH - MARGINS.right]).domain([2000, 2010]),
      yScale = d3.scale.linear().range([HEIGHT - MARGINS.top, MARGINS.bottom]).domain([134, 215]),
      xAxis = d3.svg.axis()
      .scale(xScale),
      yAxis = d3.svg.axis()
      .scale(yScale)
      .orient("left");

    vis.append("svg:g")
      .attr("class", "x axis")
      .attr("transform", "translate(0," + (HEIGHT - MARGINS.bottom) + ")")
      .call(xAxis);
    vis.append("svg:g")
      .attr("class", "y axis")
      .attr("transform", "translate(" + (MARGINS.left) + ",0)")
      .call(yAxis);
    var lineGen = d3.svg.line()
      .x(function(d) {
        return xScale(d.year);
      })
      .y(function(d) {
        return yScale(d.sale);
      })
      .interpolate("basis");
    vis.append('svg:path')
      .attr('d', lineGen(data))
      .attr('stroke', 'green')
      .attr('stroke-width', 2)
      .attr('fill', 'none');
    vis.append('svg:path')
      .attr('d', lineGen(data2))
      .attr('stroke', 'blue')
      .attr('stroke-width', 2)
      .attr('fill', 'none');
  }

  InitChart();
3gwebtrain
  • 14,640
  • 25
  • 121
  • 247
  • What is your code? What have you tried yourself? Maybe you could set up a JSFiddle. – altocumulus Aug 19 '15 at 10:44
  • @altocumulus - already i have added live demo link. as well added the `js code` or reference – 3gwebtrain Aug 19 '15 at 11:05
  • 1
    See https://stackoverflow.com/questions/25901271/using-d3-to-shade-area-between-two-lines or https://stackoverflow.com/questions/21294056/need-help-plotting-area-between-multivariate-lines-not-from-axis-to-line – Lars Kotthoff Aug 19 '15 at 16:50

1 Answers1

4

You should use d3.svg.area to achieve this :

 var area = d3.svg.area()
  // Same x axis (could use .x0 and .x1 to set different ones)
  .x(function(d, i) { return xScale(data[i].year); })
  .y0(function(d, i) { return yScale(data[i].sale); })
  .y1(function(d, i) { return yScale(data2[i].sale); })
  .interpolate("basis");

vis.append("path")
  .datum(data)
  .attr("d", area)
  .attr("fill", "#CCC");

Here is your modified plunkr :

http://plnkr.co/edit/1juPlaHyZcVujaR0yKLl

codename44
  • 867
  • 9
  • 19