I am having problems even getting off the ground with Highcharts maps.
I followed the rails installation.
Gemfile
gem "highcharts-rails", "~> 3.0.0"
application.js
  //= require highcharts
  //= require highcharts/highcharts-more
  //= require highcharts/modules/data
  //= require highcharts/modules/map
In my page
  <div id="container" style="height: 500px; min-width: 310px; max-width: 600px; margin: 0 auto"></div>

<script>

  $(function () {

    // Prepare demo data
    var data = [{
        'hc-key': 'us',
        value: 3
    }, {
        'hc-key': 'ca',
        value: 5
    }, {
        'hc-key': 'mx',
        value: 20
    }];


    // Initiate the chart
    $('#container').highcharts('Map', {

        title: {
            text: 'Showing only non-null areas'
        },

        subtitle: {
            text: 'The <em>allAreas</em> option is false'
        },

        mapNavigation: {
            enabled: true,
            buttonOptions: {
                verticalAlign: 'bottom'
            }
        },

        colorAxis: {
            min: 0
        },

        series: [{
            data: data,
            mapData: Highcharts.maps['custom/north-america-no-central'],
            joinBy: 'hc-key',
            allAreas: false,
            name: 'Random data',
            states: {
                hover: {
                    color: '#BADA55'
                }
            },
            dataLabels: {
                enabled: true,
                format: '{point.name}'
            }
          }]
        });
      });

   </script>
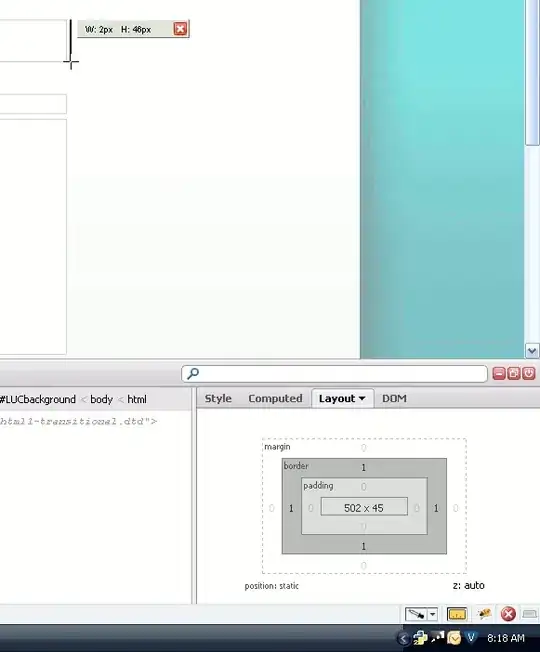
As you can see from the screenshot, there is no map rendered.
I have seen a similar question here:
Highmaps with US States in Rails
but I have tried these permutations and combinations of placing the links to the js files in my application header without success. The simple "your first chart" installation in the docs works fine
http://www.highcharts.com/docs/getting-started/your-first-chart
.....as soon as I try maps, no joy.
EDIT
So,
if i remove the files from application.js and add
   <script src="http://code.highcharts.com/maps/highmaps.js"></script>
   <script src="http://code.highcharts.com/maps/modules/data.js"></script>
   <script src="http://code.highcharts.com/mapdata/custom/world.js"></script>
to my application header....the following works..
      <div id="container" style="height: 500px; min-width: 310px; max-width: 600px; margin: 0 auto"></div>


  <script>
    $(function () {

    $.getJSON('http://www.highcharts.com/samples/data/jsonp.php?filename=world-population-density.json&callback=?', function (data) {

        // Add lower case codes to the data set for inclusion in the tooltip.pointFormat
        $.each(data, function () {
            this.flag = this.code.replace('UK', 'GB').toLowerCase();
        });

        // Initiate the chart
        $('#container').highcharts('Map', {

            title: {
                text: 'Fixed tooltip with HTML'
            },

            legend: {
                title: {
                    text: 'Population density per km²',
                    style: {
                        color: (Highcharts.theme && Highcharts.theme.textColor) || 'black'
                    }
                }
            },

            mapNavigation: {
                enabled: true,
                buttonOptions: {
                    verticalAlign: 'bottom'
                }
            },

            tooltip: {
                backgroundColor: 'none',
                borderWidth: 0,
                shadow: false,
                useHTML: true,
                padding: 0,
                pointFormat: '<span class="f32"><span class="flag {point.flag}"></span></span>'
                + ' {point.name}: <b>{point.value}</b>/km²',
                positioner: function () {
                    return { x: 0, y: 250 };
                }
            },

            colorAxis: {
                min: 1,
                max: 1000,
                type: 'logarithmic'
            },

            series : [{
                data : data,
                mapData: Highcharts.maps['custom/world'],
                joinBy: ['iso-a2', 'code'],
                name: 'Population density',
                states: {
                    hover: {
                        color: '#BADA55'
                    }
                  }
               }]
             });
          });
      });
   </script>
Surely there has to be a nice "rails" way to get this working without explicitly calling the files in the header?
