0

Morning Community,

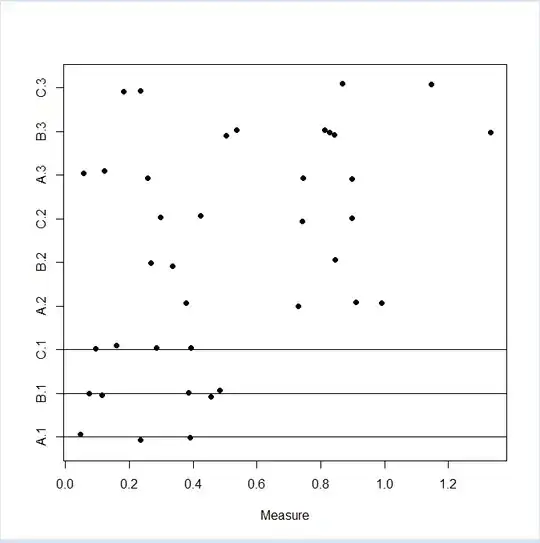
I was learning how to use stripchart() in R as well as the abline()function to draw arbitrary lines in the graph. I was able to draw horizontal lines when I was grouping with one variable, but was unsuccessful with two or more.

My data:

Group   Subgroup    Measure
A   1   0.234213
A   1   0.046248
A   1   0.391376
A   2   0.911849
A   2   0.729955
A   2   0.99111
A   2   0.378422
A   3   0.898037
A   3   0.258884
A   3   
A   3   0.057631
A   3   0.745202
A   3   0.121376
B   1   0.385198
B   1   0.484399
B   1   0.115034
B   1   0.073629
B   1   0.45615
B   2   0.336108
B   2   0.845458
B   2   0.267494
B   3   0.536123
B   3   1.331731
B   3   0.505114
B   3   0.843348
B   3   0.827932
B   3   0.813351
C   1   0.095587
C   1   0.158822
C   1   0.392376
C   1   0.284625
C   2   0.898819
C   2   0.743428
C   2   0.298989
C   2   0.423961
C   3   0.868351
C   3   0.181547
C   3   1.146131
C   3   0.234941

My code:

stripchart(Measure~Group*Subgroup,data=mydata,method="jitter",pch=19,jitter=0.1,col="black")
abline(h=mydata$Group)

My Results: Picture Results

My Assessment: Wouldn't the abline() code apply the line to all Y-variables that has the category 'Group'? Or is it that I need to generate a new vector that combines Group and Subgroup? I have tried abline(h=mydata$Group*mydata$Subgroup) but this gives me the following error:

Warning message:
In Ops.factor(mydata$Group, mydata$Subgroup) :
  ‘*’ not meaningful for factors

In Hindsight, this wasn't going to work becuase the documentation for abline() does not allow functions. However, when I tried adding abline(h=mydata$Subgroup) The lines did not work either.
Bluebird
  • 531
  • 1
  • 5
  • 18
  • 2
    `abline` works how it does as described by `?abline`, i.e., h are *numeric* values along the y-axis describing the locations of the horizontal lines, not how you might want it to. Where is A.1 and C.1 along the number line? How far are they apart? it is a very happy coincidence that your first code actually worked, so you should also read about `?factor`s – rawr Aug 07 '15 at 14:31
  • @NicE Thanks, if you would please write that as an answer, I would like to mark it. (With a minor adjustment) `abline(h=as.factor(unique(paste(mydata$Group,mydata$Subgroup,sep="."))))`. But before I go, I wanted to check my understanding of what you wrote: it forced the two vectors as factors, then it made a list that combined the values from Group and Subgroup into one separated by ".". Group "A", Subgroup "1" => Code => Group.Subgroup "A.1" – Bluebird Aug 07 '15 at 14:33
  • @rawr I will certainly do so. Thanks for your input! – Bluebird Aug 07 '15 at 14:34
  • 2
    @Riorank Nice's answer worked because factors are actually integers from 1 to n. your y-labels are at 1, 2, ..., so try `abline(h = 3, col = 'red')` and see where the line ends up. however, this answer doesn't *really* work because the order of the factors and your order along the y-axis are not identical.. the factor levels are `A.1 A.2 A.3 ...` corresponding to `1, 2, 3 ...` but your ordering is `A.1 B.1 C.1 ...` – rawr Aug 07 '15 at 14:40
  • @NicE I just did a quick scan of `?unique`. Correct me if I am wrong: in the [list, vector, dataframe] that is made, if there are any duplicates (by duplicates, I mean exact duplicates, permutations don't count), delete it. – Bluebird Aug 07 '15 at 14:41
  • @rawr nice didn't know that, don't use it then – NicE Aug 07 '15 at 14:41
  • @rawr I just ran `abline(h = 3, col = 'red')`. It would seem that the plot (assigns? Not sure of the word here) numerical values (1,2,3...n) to each Y-category ("1" for "A.1", "2" for "B.2"). I always thought they were referred as themselves ("A.1" for "A.1"). This is good to know, knowing that each Y-variable is assigned a number for reference. Thanks! – Bluebird Aug 07 '15 at 14:45

0 Answers0