1

I need to evaluate a function (say) Fxy = 2*x.^2 +3 *y.^2; on a ternary grid x-range (0 - 1), y-range (0-1) and 1-x-y (0 - 1). I am unable to construct the ternary grid on which I need to evaluate the above function. Also, once evaluated I need to plot the function in a ternary contour plot. Ideally, I need the axes to go counter clockwise in the sense (x -> y--> (1-x-y)).

I have tried the function

function tg = triangle_grid ( n, t )

  ng = ( ( n + 1 ) * ( n + 2 ) ) / 2;
  tg = zeros ( 2, ng );

  p = 0;

  for i = 0 : n
    for j = 0 : n - i
      k = n - i - j;
      p = p + 1;
      tg(1:2,p) = ( i * t(1:2,1) + j * t(1:2,2) + k * t(1:2,3) ) / n;
    end
  end

  return
end

for the number of sub intervals between the triangle edge coordinates

n = 10 (say)

and for the edge coordinates of an equilateral triangle

t = tcoord = [0.0, 0.5,           1.0;
              0.0, 1.0*sqrt(3)/2, 0.0];

This generated a triangular grid with the x-axis from 0-1 but the other two are not from 0-1.

I need something like this:

wiki link

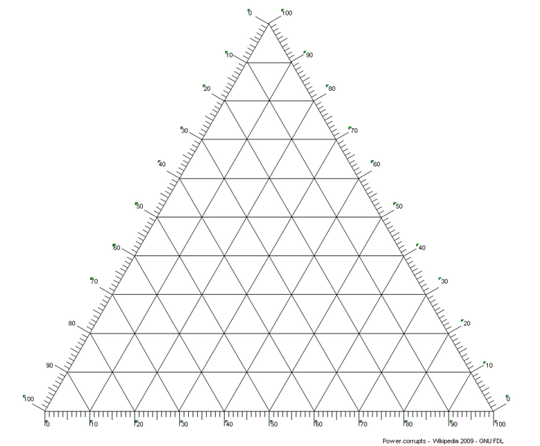
... with the axes range 0-1 (0-100 would also do).

In addition, I need to know the coordinate points for all intersections within the triangular grid. Once I have this I can proceed to evaluate the function in this grid.

My final aim is to get something like this. This is a better representation of what I need to achieve (as compared to the previous plot which I have now removed)

better representation

Note that the two ternary plots have iso-value contours which are different in in magnitude. In my case the difference is an order of magnitude, two very different Fxy's.

If I can plot the two ternary plots on top of each other then and evaluate the compositions at the intersection of two iso-value contours on the ternary plane. The compositions should be as read from the ternary plot and not the rectangular grid on which triangle is defined. Currently there are issues (as highlighted in the comments section, will update this once the problem is closer to solution).

chthonicdaemon
  • 19,180
  • 2
  • 52
  • 66
jam_27
  • 35
  • 1
  • 7
  • What about https://www.mathworks.com/matlabcentral/fileexchange/2299-alchemyst-ternplot – Ander Biguri Jul 28 '15 at 13:17
  • Yes, but as far as I can see, it uses measured data. I need to generate data based on the function. – jam_27 Jul 28 '15 at 13:30
  • Oh I see. You dont want a ternary plot. You just want to plot in the areas where 1-x-y are in range (0-1), right? – Ander Biguri Jul 28 '15 at 13:35
  • I do want a ternary plot, but I need to generate the data first on a triangular grid. For this, as far as I understand, I need to generate the triangular grid first on which I will to evaluate the function Fxy. Once I have the generated data, I need to plot the data in a ternary conout plot. – jam_27 Jul 28 '15 at 13:38
  • Forgive my ignorance, but isn't a ternary plot a plot with 3 variables? you only have 2. Of course, if you crop your 2D grid with your conditions the result will be a triangle, but not a ternary plot. – Ander Biguri Jul 28 '15 at 13:39
  • x is one variable, y is another, z = 1-x-y is the 3rd. For a ternary plot, x +y + z should be 1. – jam_27 Jul 28 '15 at 13:42
  • But `Fxy = 2*x.^2 +3 *y.^2` has no `z`, thus a 3rd dimension is unecesary – Ander Biguri Jul 28 '15 at 13:43
  • I think the fileexchange submissio I refered to is the thing you want, definetly. – Ander Biguri Jul 28 '15 at 15:35
  • I cannot find the piece of code in matlab fileexchange which I can use to generate the grid I need. – jam_27 Jul 28 '15 at 15:39
  • The ternplot package supplies things that can help you, but there is unfortunately not a one-stop function which works as easily as one would hope for this. See my answer below. – chthonicdaemon Jul 28 '15 at 17:18
  • I've updated my answer to show how the intersection between two functions can be plotted. Unfortunately, you updated the second graph while I was working on it. That graph appears much more like the "basic' usage of ternplot and terncontour, but with linear interpolation. If you post your data, I can recreate that plot very easily. – chthonicdaemon Jul 29 '15 at 13:39

3 Answers3

2

I have played a bit with the file exchange submission https://www.mathworks.com/matlabcentral/fileexchange/2299-alchemyst-ternplot.

if you just do this:

[x,y]=meshgrid(0:0.1:1);
Fxy = 2*x.^2 +3 *y.^2;
ternpcolor(x(:),y(:),Fxy(:))

You get:

enter image description here

The thirds axis is created exactly as you say (1-x-y) inside the ternpcolor function. There are lots of things to "tune" here but I hope it is enough to get you started.

Ander Biguri
  • 35,140
  • 11
  • 74
  • 120
  • Thanks, but this uses the same grid which is generated in the function I have used initially. Thus, the value of the function at the top is the same as on the right. This is because the grid is still Cartesian and not Triangular (Barycentric?). The axes label (in the file exchange submission) are separate from the actual grid. – jam_27 Jul 28 '15 at 16:04
  • I have absolutely no idea of what you say (because I am totally inexperienced in this kind of plots) and unfortunately I feel that I can not help you :(. Sorry about that. @jam_27. Good luck – Ander Biguri Jul 28 '15 at 16:09
  • its my first time too with ternary plots. Hopefully someone else with more experience will pick this up. – jam_27 Jul 28 '15 at 16:10
  • 1
    This does not do what you may expect. `ternpcolor` uses `griddata` internally to interpolate from data, and you are supplying effectively points on a line from the bottom left vertex to the middle of the top right edge. Only those points are correct, the rest are inferred from cubic interpolation. – chthonicdaemon Jul 28 '15 at 17:22
  • @chthonicdaemon I see. Then `[x,y]=meshgrid(0:0.1:1); Fxy = 2*x.^2 +3 *y.^2; ternpcolor(x(:),y(:),Fxy(:))` should work rigth? gives practically the same result. – Ander Biguri Jul 29 '15 at 10:47
  • As you can see for your example dialog, there are some issues handling the edges (there is a white region in the bottom left corner due to NaN results). – chthonicdaemon Jul 29 '15 at 11:57
  • @chthonicdaemon I think its actually offset. The "surf" plotted on top of the ternary axis crosses it in that point. Most likely easy to solve. (you can see this by rotating the plot bi hand as a 3D surf) – Ander Biguri Jul 29 '15 at 12:22
2

I am the author of ternplot. As you have correctly surmised, ternpcolor does not do what you want, as it is built to grid data automatically. In retrospect, this was not a particularly wise decision, I've made a note to change the design. In the mean time this code should do what you want:

EDIT: I've changed the code to find the intersection of two curves rather than just one.

N = 10;
x = linspace(0, 1, N);
y = x;

% The grid intersections on your diagram are actually rectangularly arranged,
% so meshgrid will build the intersections for us
[xx, yy] = meshgrid(x, y);
zz = 1 - (xx + yy);

% now that we've got the intersections, we can evaluate the function
f1 = @(x, y) 2*x.^2 + 3*y.^2 + 0.1;
Fxy1 = f1(xx, yy);
Fxy1(xx + yy > 1) = nan;

f2 = @(x, y) 3*x.^2 + 2*y.^2;
Fxy2 = f2(xx, yy);
Fxy2(xx + yy > 1) = nan;

f3 = @(x, y) (3*x.^2 + 2*y.^2) * 1000; % different order of magnitude
Fxy3 = f3(xx, yy);
Fxy3(xx + yy > 1) = nan;

subplot(1, 2, 1)
% This constructs the ternary axes
ternaxes(5);

% These are the coordinates of the compositions mapped to plot coordinates
[xg, yg] = terncoords(xx, yy);
% simpletri constructs the correct triangles
tri = simpletri(N);

hold on
% and now we can plot
trisurf(tri, xg, yg, Fxy1);
trisurf(tri, xg, yg, Fxy2);
hold off
view([137.5, 30]);

subplot(1, 2, 2);
ternaxes(5)
% Here we plot the line of intersection of the two functions
contour(xg, yg, Fxy1 - Fxy2, [0 0], 'r')
axis equal

enter image description here

EDIT 2: If you want to find the point of intersection between two contours, you are effectively solving two simultaneous equations. This bit of extra code will solve that for you (notice I've used some anonymous functions in the code above now, as well):

f1level = 1;
f3level = 1000;
intersection = fsolve(@(v) [f1(v(1), v(2)) - f1level; f3(v(1), v(2)) - f3level], [0.5, 0.4]);
% if you don't have the optimization toolbox, this command works almost as well
intersection = fminsearch(@(v) sum([f1(v(1), v(2)) - f1level; f3(v(1), v(2)) - f3level].^2), [0.5, 0.4]);

ternaxes(5)
hold on
contour(xg, yg, Fxy1, [f1level f1level]);
contour(xg, yg, Fxy3, [f3level f3level]);
ternplot(intersection(1), intersection(2), 1 - sum(intersection), 'r.');
hold off

enter image description here

chthonicdaemon
  • 19,180
  • 2
  • 52
  • 66
  • 1
    your approach gives me the correct values of the function at the grid intersection points, but as the grid points are still in rectangular coordinates, the values of the axes read, say by putting a pointer on the intersection gives me indices in rectangular coordinates, opposed to what one would desire, i.e. intersection acc to defined axes. Another issue, is that the "hold on" does not seem to work. If I need to plot two different functions on top of each other on the same triangular axes in order to see where the contour intersect and get the corresponding x,y values, I am unable to do so. – jam_27 Jul 29 '15 at 12:16
  • Fantastic ;) Good job! – Ander Biguri Jul 29 '15 at 12:22
  • I will look into adding support for the tooltip/pointer in these coordinates. I wrote ternplot before it the tooltip functionality existed in Matlab, so I tend not to use it (or miss it). Perhaps you can file an issue on the repository. Regarding the second question, the code I posted above will allow you to add a second plot only doing a second `trisurf`. If the final goal is to find the line of equality for two surfaces, consider plotting the contour of the difference. – chthonicdaemon Jul 29 '15 at 12:25
  • I've added code to plot two surfaces and plot the intersection of two surfaces. The only thing I can't do is to have the tooltips give the correct values. – chthonicdaemon Jul 29 '15 at 13:24
  • Thanks for updating the code, However this is not what is needed as mentioned in my question (bottom). May be I should have elaborated a bit more. The two functions I have do not interest. They have very different magnitudes. If I could plot ternary contour plots of each function on top of each other, there will some iso-value contours for each function which would intersect in the ternary plane. I need to get the values of x,y for this intersection point. I have a quaternary version of the similar problem and I can get what I want without issues. This is my first time with ternary! – jam_27 Jul 29 '15 at 16:20
0

Here is a solution using R and my package ggtern. I have also included the points within proximity underneath, for the purpose of comparison.

library(ggtern)

Fxy      = function(x,y){ 2*x^2 + 3*y^2 }
x = y    = seq(0,1,length.out = 100)
df       = expand.grid(x=x,y=y); 
df$z     = 1 - df$x - df$y
df       = subset(df,z >= 0)
df$value = Fxy(df$x,df$y)

#The Intended Breaks
breaks = pretty(df$value,n=10)

#Create subset of the data, within close proximity to the breaks
df.sub = ldply(breaks,function(b,proximity = 0.02){
  s = b - abs(proximity)/2; f = b + abs(proximity)/2
  subset(df,value >= s & value <= f)
})

#Plot the ternary diagram
ggtern(df,aes(x,y,z)) + 
  theme_bw() + 
  geom_point(data=df.sub,alpha=0.5,color='red',shape=21) + 
  geom_interpolate_tern(aes(value = value,color=..level..), size = 1, n = 200,
                        breaks    = c(breaks,max(df$value) - 0.01,min(df$value) + 0.01),
                        base      = 'identity',
                        formula   = value ~ poly(x,y,degree=2)) +
  labs(title = "Contour Plot on Modelled Surface", x = "Left",y="Top",z="Right")

Which produces the following:

example

Nicholas Hamilton
  • 10,044
  • 6
  • 57
  • 88