SPSS treats multi response sets differently from categorical vars when it comes to z-tests in custom tables. I assume that this behaviour is linked to the overlap of the responses, but I cannot figure out how.
So, how does SPSS do z-testing when it comes to multi response sets (MRsets)?
My goal is to reproduce SPSS z-test for MRsets in R, but I cannot figure out what SPSS actually does. Normally, SPSS custom table z-testing is just the same as
prop.test(c(proportion1,proportion2),c(columnSum1,columSum2),"two.sided",correct=F)
but it is different with MRsets, obviously.
To make this clear, please take a look at this categorical versus MRset comparison.
Categorical var z-test (C & D columns are not different according to z-test)
- Categorical dataset (no overlap, 3623 cases): Download dataset
- Categorical overlap matrix (no overlap):

Categorcial z-test SPSS syntax
CTABLES
  /VLABELS VARIABLES=splitVar catVar DISPLAY=DEFAULT
  /TABLE splitVar [C][COUNT F40.0] BY catVar [C]
  /CATEGORIES VARIABLES=splitVar catVar ORDER=A KEY=VALUE EMPTY=EXCLUDE
  /COMPARETEST TYPE=PROP ALPHA=0.05 ADJUST=NONE ORIGIN=COLUMN INCLUDEMRSETS=NO CATEGORIES=ALLVISIBLE.
Categorcial z-test output:

R reproduction for C<->D z-test (first row): http://www.r-fiddle.org/#/fiddle?id=p4gw9ftk
"Categorical var z-test"
"Doing a proportions test for first row (splitVar=1) and columns C and D"
prop.test(c(198,242), c(198+35,242+65), alternative="two.sided", correct=F )
"As we see, there are no significant differences in the proportions on an alpha=0.05 level"


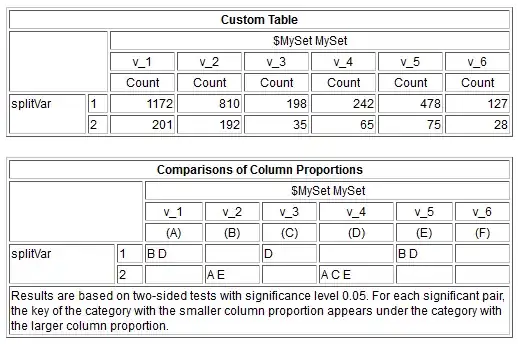
MRset z-test (identical numbers in table, but different z-test result: significant differences in C & D columns)
- MRset dataset (overlaps included, 2404 cases): Download dataset
- MRset overlap matrix:

- MRset z-test output:
MRset z-test SPSS syntax:
CTABLES
    /VLABELS VARIABLES=splitVar $MySet DISPLAY=DEFAULT
    /TABLE splitVar [C] BY $MySet [C][COUNT F40.0]
    /CATEGORIES VARIABLES=splitVar ORDER=A KEY=VALUE EMPTY=EXCLUDE
    /CATEGORIES VARIABLES=$MySet  EMPTY=INCLUDE
    /COMPARETEST TYPE=PROP ALPHA=0.05 ADJUST=NONE ORIGIN=COLUMN INCLUDEMRSETS=YES CATEGORIES=ALLVISIBLE.
R reproduction for C<->D z-test (first row): http://www.r-fiddle.org/#/fiddle?id=GAhnnrv0
"MRset z-test"
"Doing a proportions test for first row (splitVar=1) and columns C and D"
overlap_splitvar1_CD <- 53
overlap_splitvar2_CD <- 9
prop.test(c(198-overlap_splitvar1_CD,242-overlap_splitvar1_CD), c(198+35-overlap_splitvar1_CD-overlap_splitvar2_CD,242+65-overlap_splitvar1_CD-overlap_splitvar2_CD), alternative="two.sided", correct=F )
"As we see, there are still no significant differences in the proportions on an alpha=0.05 level. In contrast, SPSS does detect a difference. Why?"


As you can see from the MRset R code, even a subtraction of overlap cases does not help. Maybe it is linked to weighting or something? Thanks so much for ideas.
Possibly helpful link: A Note on Weights and Multiple Response Sets