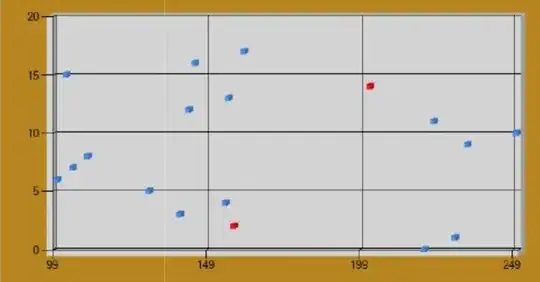
I am trying to render a spline chart with PUBNUB EON charting library. I do not understand what is going wrong here. I can see the data in console, but the chart is not rendering, there are only x and y axis lines. I am getting the data from python SDK and subscribing via javascript SDK. There is no error message in the console.
My python code is
def counterVolume(data):
  for each in data:
    y = each.counter_volume
    data_clean = json.dumps(y, indent=4, separators=(',', ': '))
    print pubnub.publish(channel='channel', message= data_clean)


counterVolume(data)
My subscribe javascript function is
       var data;
       var pubnub = PUBNUB.init({
                                publish_key: 'pub',
                                subscribe_key: 'subf'
                                            });

       var channel = "c3-spline";
                    eon.chart({
                             history: true,
                            channel: 'channel',
                             flow: true,
                               generate: {
                                bindto: '#chart',
                                data: {
                                x: 'x',
                                labels: false
                                        },
                               axis : {
                                  x : {
                                  type : 'timeseries',
                                  tick: {
                                 format: '%m-%d %H:%M:%S'
                                        }
    }
    } }});
    function dataCallback(){
                        pubnub.subscribe({
                                  channel: 'channel',
                                  message: function(m){
                                           data = m
                                           console.log(data)
          }
        });
        };
 dataCallback();
 pubnub.publish({
                     channel: 'orbit_channel',
                     message: {
                            columns: [
                                     ['x', new Date().getTime()],
                                     ['y', data]
              ]
            }
          })
I can see the values in console but I do not understand why it wont render on chart.

the result of python script:
89453.0
89453.0
89453.0
89453.0