168

I use AJAX and want to visit its behaivour while sending request to server through Chrome Inspector. When I switch to Network tab of inspector, requests not listing there.
example


Edit

Inspector is open and network tab is active, now I'll do something to trigger ajax request, but no report in inspector. I mean the situation is fully ready for inspector to show results, but some configuration should be changed.
Pacerier
  • 86,231
  • 106
  • 366
  • 634
Hossein Shahsahebi
  • 6,348
  • 5
  • 24
  • 38
  • Did the AJAX request happen before or after you switched to the Network tab? The network tab only records activity that happens after you bring it up. – Michael Aaron Safyan Jul 13 '15 at 08:59
  • @MichaelAaronSafyan thanks for answer, yes inspector is open and network tab is active, now I'll do something to trigger ajax request, but no report in inspector – Hossein Shahsahebi Jul 13 '15 at 09:05
  • Can you confirm that your instance of Chrome doesn't return anything in the Network tab from this page: http://jsfiddle.net/clickthelink/Uwcuz/1/ – Irvin Lim Jul 13 '15 at 09:12
  • @IrvinLim thanks for answer, again as my screenshot just show it's diagram and status bar at bottom of page. But no result or report for the path, status, domain and etc. – Hossein Shahsahebi Jul 13 '15 at 09:22

18 Answers18

242

As I said some configuration changed. All I need to do is click on filter icon (it's active when it's color is blue).
And then select the type of request I want to see. Default option is to select All or just to visit xhr request, select xhr.

enter image description here

Hossein Shahsahebi
  • 6,348
  • 5
  • 24
  • 38
139

Just simple trick if any one of the above solution doesn't work then follow below steps

1: Go to inspect tab

2: click on setting icon as show below

2: click on setting as show below

3: Preference -> Click on Restore default and reload button see the image for reference

3: Preference -> Restore default see the image for reference

SATISH RAJNALE
  • 1,451
  • 1
  • 6
  • 8
29

Be sure that there is nothing in the Filter field.

enter image description here

mustapha mekhatria
  • 3,495
  • 1
  • 20
  • 26
17

enter image description here

As showed in the screenshots above

  1. 1.press 'F12 key' and go network menu and check if your Has blocked cookies is checked or not
  2. if checked and then uncheck it and refresh using F5.

I hope this might helps you....

Raman Sharma
  • 241
  • 4
  • 11
14

screenshots As showed in the screenshots sequence above

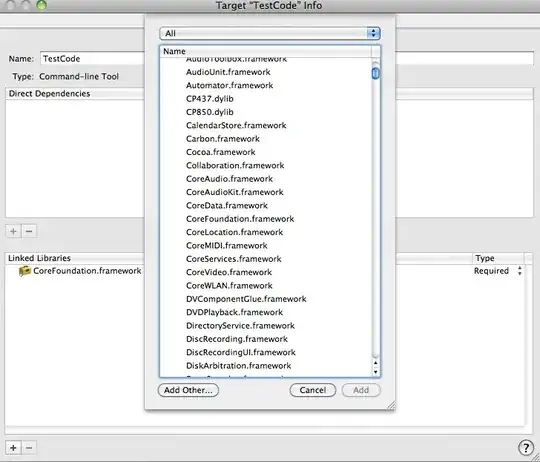
  1. press 'F12 key' and go network menu click on 'Filter Icon'
  2. uncheck "Only show requests with SameSite issues" checkbox
  3. reload chrome browser by pressing 'F5 Key'
Roberto Caboni
  • 7,252
  • 10
  • 25
  • 39
brajesh
  • 151
  • 1
  • 2
  • Thanks, it's kinda confusing because that filter icon does not visually change when toggling the bar. – Nik Feb 18 '22 at 18:36
8

In my case, I had mistakenly typed some character in the filter search box. CLearing the filter box worked fine.

Milan Paudyal
  • 519
  • 9
  • 11
8
  1. Press F12 and go to network menu click on 'Filter Icon'
  2. See if any among "Hide data URLs" , "Has blocked cookies" and "Blocked Requests" is checked, uncheck it.
  3. reload chrome browser by pressing F5
Nilesh
  • 81
  • 1
  • 1
8

hello i was trying to develop a form page with php and ajax and i faced the same problem. The filter input box above looked 0.5 by default. When I cleared the filter input box the problem was resolved and I could see the requests.

enter image description here

Paolo Mossini
  • 1,064
  • 2
  • 15
  • 23
7

In my case, i typed something in filter box and forgot about it, it remained there even after restarting pc several times, had to remove it to see all the network requests again.

enter image description here

Kritish Bhattarai
  • 1,501
  • 15
  • 20
2

Next to the filter box, there is an option to check/uncheck "Hide data URLs". If it is selected, filter would appear RED.

PRK
  • 63
  • 3
2

In my case for Chromium, the solutions was to tick the "Preserve log" checkbox in the filter toolbar. The error I am hunting for is of 404 HTTP-code type and Chromium hides the log line, then reloads and shows the Chromium default error page, along with filling the log pane with lines about loading the some data-url images.

Mna
  • 370
  • 4
  • 7
2

I had this issue where the time filter was unable to get earlier events. I think this is because the width of the waterfall dragger was obscuring the filter.

An easy workaround is to download the HAR file (see the down arrow) and then open a new tab and then re-upload. Cleared all of those annoying filters and I was able to see those early network calls again.

1

If the filter icon is red. Click the icon then select "all" in the filtering bar. You will only see js files. Refresh your url and you will see all the files.

The icon will also turn blue.

Nimantha
  • 6,405
  • 6
  • 28
  • 69
0

For me, nothing was present in the Filters box, but the JS option was selected.

Selecting the 'All' option will start showing all the requests.

enter image description here

Gru
  • 817
  • 13
  • 20
0

Also, check if the option "All" is selected or you are checking for a specific type for select multiple types next to Filter box

0

find word in filter search bar

This can be one of the case, I entered ctrl+f to find some word on screen but it had searched in dev-tool search bar and listed only calls that had searched phrase in it.Clearing search filter in dev tool helped in my case. note: the filer is persistent even if you open new window or even tab.

Peter Csala
  • 17,736
  • 16
  • 35
  • 75
Z Warrior
  • 11
  • 1
0

This worked for me by select "All" in the developers tool page.

C Raghava
  • 9
  • 1
  • Your answer could be improved with additional supporting information. Please [edit] to add further details, such as citations or documentation, so that others can confirm that your answer is correct. You can find more information on how to write good answers [in the help center](/help/how-to-answer). – Community Apr 06 '22 at 09:09
0

For users using modern javascript libraries such as React JS, Please check the Fetch/XHR tab. I've attached a picture for you to look over.enter image description here

iC7Zi
  • 1,528
  • 2
  • 15
  • 21