I have done an FFT on an audio signal and want to plot the results on a logarithmic scale like this
http://abletonuniverse.altervista.org/wp-content/uploads/2013/04/Spectrum.jpg
but for some reason I can't figure out how to scale the data to fit that logarithmic curve (starting from 0, ending at the nyquist frequency i.e. Samplingrate / block size).
Currently this is what I have
CGContextMoveToPoint(context, 0, rect.size.height);

// Skip the DC Offset (index 0)
for (int i = 1; i < _bins; i++) {
    // Get frequency from bin
    float binFreq = i * 44100.0 / (_bins * 2);

    // Map to rect coordinate space
    float x = log10f(binFreq) * rect.size.width / log10f(44100.0 / 2);
    float y = _freqArray[i] * rect.size.height / -130.0;

    // Draw line
    CGContextAddLineToPoint(context, x, y);
}
My data comes in as 512 points of dB between 0 and ~-130 in _freqArray. Ignore the y component of the plotted point.
My data is not scaled correctly as my first bin (~43 hz) is log10(43)= 1.633 and the end of the graph is log10(22050) = 4.3, so the space between my first bin is taking up over a third of the window. It is important that I don't just put my first bin at the far left of the window the far left must be 0.
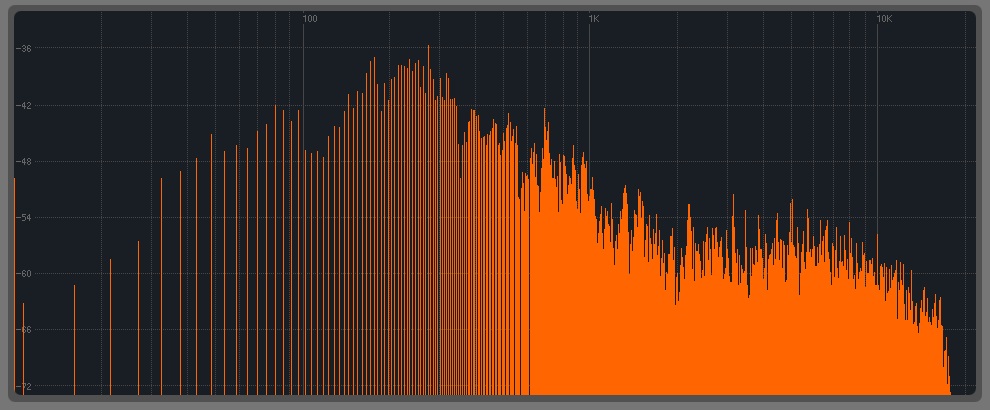
Does anybody know a correct way to scale the data into neat logarithmic bins such as in the picture? They have three neat bins representing orders of magnitude of 10, and it conveniently ends right at 22050.
For reference, this is what I have now, you can see the long straight line at the left of the spectrum. The first kink in the line is 43 hz i.e. My first bin. I am yet to put a grid up, but that will come when I figure out the scaling.