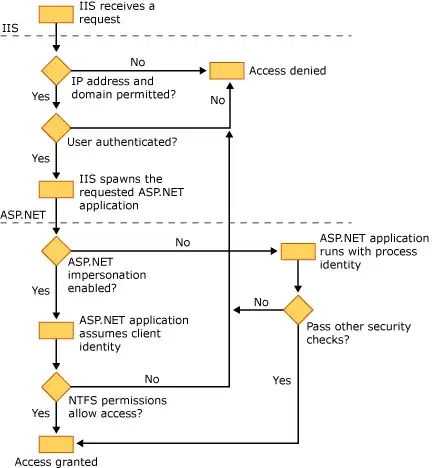
This is my graph:

What I need is to display just the 0 and 1 in the y-axis without 0.1 ,0.2, .., 0.9
Graph tag
The default type of the graph is a pie chart - to change it to a barchart change to You also may change the orientation.
:Example :
<graph string="Sales Order Lines" orientation="horizontal" type="bar">
Field tag
The first field is the X axis. The second one is the Y axis and the optional third one is the Z axis for 3 dimensional graphs. You can apply a few attributes to each field/axis:
group: if set to true, the client will group all item of the same value for this field. For each other field, it will apply an operator
operator: the operator to apply is another field is grouped. By default it's '+'.
Allowed values are: