After trying numerous different JVM GC setting and doing a lot of testing where I was having problems with long major GC pauses I'm now testing with G1GC JVM GC. Beside this I'm also collecting data with performance monitor and only applications that is running (beside system services,...) is GlassFish server with my application. I didn't find anything strange in performance monitor log (CPU usage is around 5-10% and it gets a little bit higher when GC occurs, memory is about 60% used,...). It's now fifth day of testing and I noticed following:
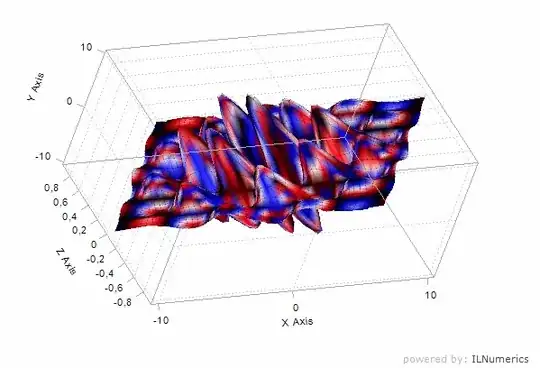
Until second major (mixed) GC occurred everything was fine (minor GC were about 20ms long, GC performance was 160000M/s,...). The second major GC took around 2 seconds (long - first took 150ms, but not critical) and after that minor GC are much longer then before (see grey lines in picture which are representing a duration of minor (young) GC) and GC performance is only 12000M/s and is still dropping. I'm wondering why is this happening after second major GC even no other applications are running and CPU/memory usage is same as before. I don't know what is happening here. I also have one more question - I'm running same test on different PC which has less RAM and older processor and GC performance there is around 5000M/s (minor GC are around 50-100ms) which I think it's normal because of worse processor and less RAM. What is strange is that major GC didn't happened yet after 3 days of running and old generation is increasing much slower than here even setting are same. Why is increasing much slower (here around 150MB in two days, on second PC 80 MB in three days)? Thank you for all your answers, I don't know why is GC acting so abnormally (first it's working fine and then the performances are worsening).
EDIT: here is complete GC log file which was imported in GCViewer and also event details statistic from GCViewer:

Log for 3rd major GC:
2015-06-08T08:09:13.123+0200: 572815.533: [GC concurrent-root-region-scan-start]
2015-06-08T08:09:13.139+0200: 572815.560: [GC concurrent-root-region-scan-end, 0.0271771 secs]
2015-06-08T08:09:13.139+0200: 572815.560: [GC concurrent-mark-start]
2015-06-08T08:09:16.302+0200: 572818.721: [GC concurrent-mark-end, 3.1612900 secs]
2015-06-08T08:09:16.318+0200: 572818.729: [GC remark 572818.729: [Finalize Marking, 0.0002590 secs] 572818.729: [GC ref-proc, 0.4479462 secs] 572819.177: [Unloading, 3.2004912 secs], 3.6499382 secs]
 [Times: user=0.20 sys=0.08, real=3.64 secs]
Again, real time was much higher than user + sys, Unloading phase took more than 3 seconds.