As stated in the comments you need to have complete data before you can calculate contours. Therefore you have to interpolate or replace your missing values in some way that makes sense in your case. I've provided a couple of options below, but you'd need to come up with rationale for using one method over another, and whether a more sophisticated geostatistical approach might be warranted. Furthermore you could interpolate to a finer grid than you currently have as well to produce a smoother result (at the expense of potentially making up data).
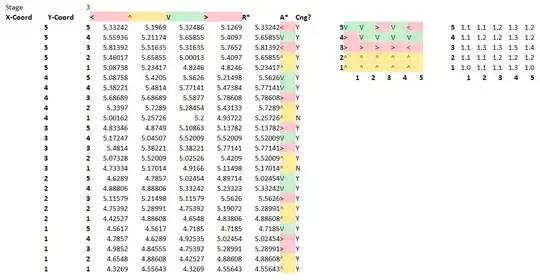
d <- read.csv("contour_map_R.csv")

library(raster)
r <- raster(as.matrix(d))

contour(r)

v <- getValues(r)
xy <- xyFromCell(r, 1:ncell(r))

##  Interpolate using a thin-plate spline:
library(fields)
tps <- Tps(xy, v)

tp <- interpolate(r, tps)
plot(tp)
contour(tp, add=T)

##  Alternatively, interpolate using nearest idw():
library(gstat)

dxy <- data.frame(x=xy[,1], y=xy[,2], v)
dxy <- dxy[complete.cases(dxy),]
id <- gstat(formula = v~1, locations = ~x+y, data=dxy)

ip <- interpolate(r, id)
plot(ip)
contour(ip, nlevels=5, add=T)

If that's what you were looking for you can get filled contours by using the filledContour() function on the interpolated rasters (tp or ip).