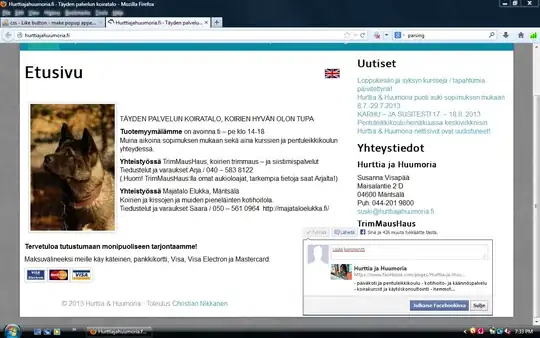
What about converting to YCbCr color space? Using the conversion formula from Wikipedia.
img = im2double(imread('StackOverflow-Example.jpg'));
rp = img(:, :, 1) / 255 ;
bp = img(:, :, 2) / 255 ;
gp = img(:, :, 3) / 255 ;
kb = 0.114;
kr = 0.299;
y = kr * rp + (1 - kr - kb) * gp + kb * bp;
y = max(max(y))-y;
y = y ./ y;
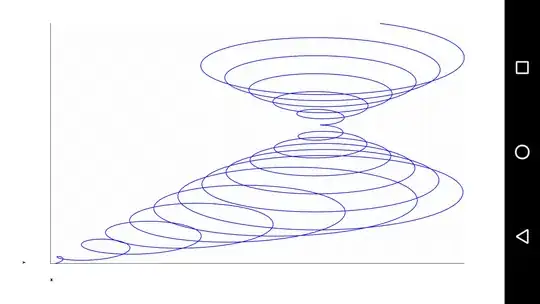
surf(y,'EdgeColor','none','LineStyle','none')
view(0, -90)
It looks like a good job of maintaining the information.
Edit:
I think you want each line
%% Load image and find intensity %%
img = im2double(imread('test.jpg')); % load image and convert to doubles to allow for calculations
rp = img(:, :, 1) / 255 ; % normalized red portion
bp = img(:, :, 2) / 255 ; % normalized blue portion
gp = img(:, :, 3) / 255 ; % normalized green portion
kb = 0.114; % blue constant from Wikipedia
kr = 0.299; % red constant from Wikipedia
x = kr * rp + (1 - kr - kb) * gp + kb * bp; % normalized intensity in image
x = max(max(x))-x; % removed background

y = x ./ x; % everything left is high

z = y;
z(isnan(y)) = 0; % turn nan's to zero
divisions = find(sum(z,2) > 5); % find all lines that have less than 5 pixels
divisions = [divisions(1); divisions(diff(divisions) > 10); size(z, 1)]; % find the line breaks

rows = cell(length(divisions), 1);

for i = 1:numel(rows)-1
    line = z(divisions(i):divisions(i+1), :); % grab line
    j = divisions(i) + find(sum(line,2) > 5) - 1; % remove the white space
    line = y(j, :);
    rows{i} = line; %store the line
end

rows(numel(rows)) = [];

%% plot each line %%
for i = 1:numel(rows) ;
    figure(i) ;
    surf(rows{i},'EdgeColor','none','LineStyle','none');
    view(0, -90) ;
end

%% plot entire page %%
figure(numel(rows) + 1)
surf(y,'EdgeColor','none','LineStyle','none') % plot of entire image
view(0, -90)
Edit: 2015/05/18 15:45 GMT
This has the values for the intensity left in:
img = im2double(imread('test.jpg'));
rp = img(:, :, 1) / 255 ;
bp = img(:, :, 2) / 255 ;
gp = img(:, :, 3) / 255 ;
kb = 0.114;
kr = 0.299;
x = kr * rp + (1 - kr - kb) * gp + kb * bp;
x = max(max(x))-x;
xp = x;
xp(xp == min(min(xp))) = nan;

y = x ./ x;

z = y;
z(isnan(y)) = 0;
divisions = find(sum(z,2) > 5);
divisions = [divisions(1); divisions(diff(divisions) > 10); size(z, 1)];

rows = cell(length(divisions) - 1, 1);

for i = 1:numel(rows)
    line = z(divisions(i):divisions(i+1), :);
    j = divisions(i) + find(sum(line,2) > 5) - 1;
    line = xp(j, :);
    rows{i} = line;

    figure(i) ;
    surf(rows{i},'EdgeColor','none','LineStyle','none');
    axis('equal')
    view(0, -90) ;
end

figure(numel(rows) + 1)
surf(xp,'EdgeColor','none','LineStyle','none')
axis('equal')
view(0, -90)
Edit 2015-05-22 13:21 GMT
%Turn warning message off
warning('off', 'Images:initSize:adjustingMag');

%Read in image in int8
originalImg = imread('test.jpg');

%Convert to double
img = im2double(originalImg);

%Take R, G, & B components
rp = img(:, :, 1) ;
gp = img(:, :, 2) ;
bp = img(:, :, 3) ;

%Get intensity
kb = 0.114;
kr = 0.299;
yp = kr * rp + (1 - kr - kb) * gp + kb * bp;

%Flip to opposite of intensity
ypp = max(max(yp))-yp;

%Normalize flipped intensity
z = ypp ./ ypp;
z(isnan(z)) = 0;

%Find lines, this may need to be tuned
MaxPixelsPerLine = 5;
MinRowsPerLine = 10;
divisions = find(sum(z,2) > MaxPixelsPerLine);
divisions = [divisions(1); divisions(diff(divisions) > MinRowsPerLine); size(z, 1)];

%Preallocate for number of lines
colorRows = cell(length(divisions) - 1, 1);

for i = 1:numel(rows)
    %Extract the lines in RGB
    line = z(divisions(i):divisions(i+1), :);
    j = divisions(i) + find(sum(line,2) > 5) - 1;
    colorRows{i} = originalImg(j, :, :);

    %Print out the line
    figure(i) ;
    imshow(colorRows{i})
end

%Print out the oringinal image
figure(numel(rows) + 1)
imshow(originalImg)

%Turn the warning back on
warning('on', 'Images:initSize:adjustingMag');