0

Is there a way to implement a median Line using this lib?

The only way I think could work is adding a new LineSeries and add a median for each Value in my Data-LineSeries

Something like this:

    <charting:Chart>
        <charting:Chart.Series >
            <charting:LineSeries ItemsSource="{Binding Articles}"  Title="Test Title" Height="400" Width="400" IndependentValuePath="dateTime" DependentValuePath="price"  >

            </charting:LineSeries>
---Pseudo----
            <charting:LineSeries x:Name="Median" ItemsSource="{Binding Articles}" Title="Median" IndependentValuePath="dateTime" DependentValuePath="median">

            </charting:LineSeries>
        </charting:Chart.Series>
    </charting:Chart>

This would cause me to add the median Value of my Product to each Article which is..kinda unnecessary.

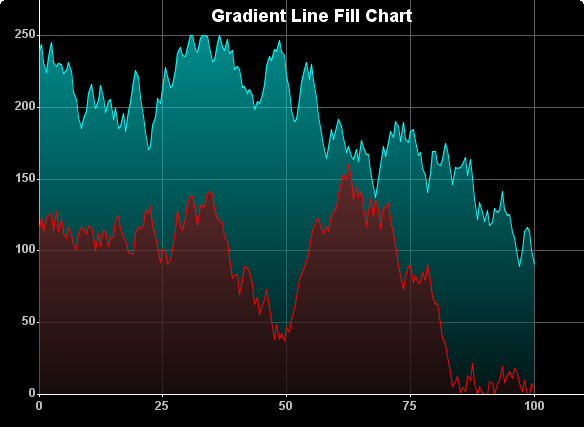
Is there an easier way to do this? Or even a way which fills the space between Data and Median with a certain color (e.g. http://www.jidesoft.com/images/line-chart-gradient-fill.png)?

Thanks in Advance

Filip Skakun
  • 31,624
  • 6
  • 74
  • 100
user1021605
  • 241
  • 3
  • 14

1 Answers1

1

I don't think there are any built in statistical functions in the DataVisualization library that I ported from Silverlight Toolkit, but you can provide your own data source separate from your Articles one that has any range of values you want.

I also can't recall if the filled style of the data series visualization is implemented, but you could try to create a modified version of the LineSeries one that does support Fill or check the source if any such property is already available. It might be doable by simply changing the Style of the series.

Filip Skakun
  • 31,624
  • 6
  • 74
  • 100
  • To draw a Medianline accros the chart I would atleast an entry for Min/Max value of Datetime of my DataLine Series. This would mean that I'd need an object with dateTime Min & median and an object with dateTime Max & median. I think, this would be a little more elegant than my solution but still kinda awkward. I'll look into the Fill thing though Thanks! P.s. Pseudo works as well, see: http://i.imgur.com/R3GXjxF.png – user1021605 May 11 '15 at 20:26
  • As a sidequestion: Is there a way to set the "negative Start point" not 0? I want sth like this http://i.imgur.com/CDn64gQ.png On values below my median and not 0. Thanks! – user1021605 May 11 '15 at 21:03
  • I don't know if it's available out of the box, but you have the sources! – Filip Skakun May 11 '15 at 21:20