I am trying to populate graph with some fixed values on X-axis and corresponding values on Y-axis. With my below script, no values are labelled on X-axis and value on Y-axis are labelled with powers.
- How to make xtics data(1000, 10000, 100000, 1000000, 10000000) appear on X-axis ?
How to get rid of powers on Y-axis ? (Example : I want 4000000 on Y-axis instead of 4x10^6
set xrange [0:]
set output "macs.png"
set ylabel "Flows/sec"
set xlabel  "MACS per Switch"
set grid
set xtics (1000, 10000, 100000, 1000000, 10000000)
set style line 2 lt 1 lw 2 pt 1 linecolor 1
plot "macs.data" using :1 with linespoints linestyle 0 title "Floodlight" // Using ":1" as X-axis data is supplied in xtics
Here is my data file :
# Not Supplying X-axis data here as it is supplied through xtics
400
60000
700000
800000
900000
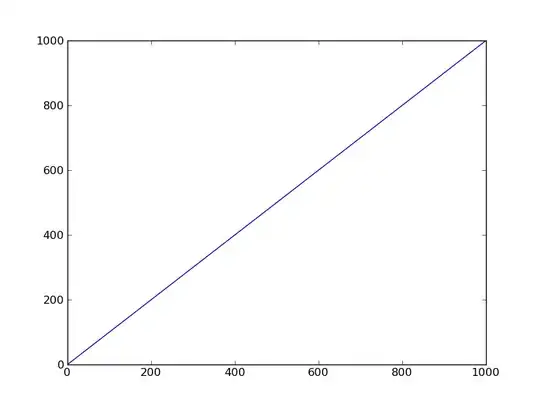
I want my populated graph with only one line to looks like this :