2

How to plot the following matrix

> a<-matrix(c(-1,0,1,0),nrow=2,ncol=2,byrow=TRUE)
> a
     [,1] [,2]
[1,]   -1    0
[2,]    1    0

as-is, i.e. in 2D, representing values in some palette, like grayscale?

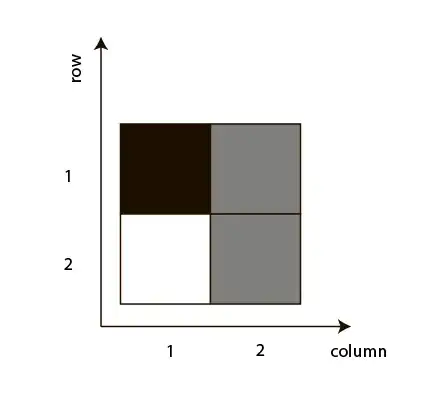
Should get something like this:

enter image description here

while with

image(a,col=grey(seq(0, 1, length = 256)))

I am getting this:

enter image description here

i.e. matrix is reoriented and rescaled.

Suzan Cioc
  • 29,281
  • 63
  • 213
  • 385

2 Answers2

5

Just transpose (t) your matrix

image(t(a),col=grey(seq(0, 1, length = 256)))

If you want the labels to start counting from 1 instead of 0 do the following: (Taken from here: r- how to edit elements on x axis in image.plot)

image(t(a),col=grey(seq(1, 0, length = 256)), axes = F)
axis(1, at=seq(1,nrow(a))-1, labels=seq(1,nrow(a)))
axis(2, at=seq(1,ncol(a))-1, labels=seq(1,ncol(a)))

Results in:

enter image description here

Community
  • 1
  • 1
Rentrop
  • 20,979
  • 10
  • 72
  • 100
1

I would do this with ggplot2. First reshape the data.

df <- reshape2::melt(a, varnames = c("y", "x"), value.name = "value")

Then plot that data.frame with geom_raster.

ggplot(df, aes_string(x = "x", y = "y", fill = "value")) + 
  geom_raster() +                        # same as image in base plot 
  scale_x_continuous(name = "column", breaks = c(1, 2)) + # name axis and choose breaks
  scale_y_reverse(name = "row", breaks = c(1, 2)) +       # reverse scale 
  scale_fill_continuous(high = "white", low = "black", guide = "none") +  # grayscale 
  theme_bw(base_size = 14)               # nicer theme 
shadow
  • 21,823
  • 4
  • 63
  • 77