I'm putting together a d3 visualisation using force layouts for use in in the Qualtrics questionnaire website. Everything seems to be working across the different browsers in a jsfiddle. Its possible to drag exemplars from the exemplar box (African male for e.g.) onto the main canvas. One can right-click on a node in the main canvas to bring up a right-click menu to change the node properties or drag the nodes around the canvas.
javascript too large to paste.
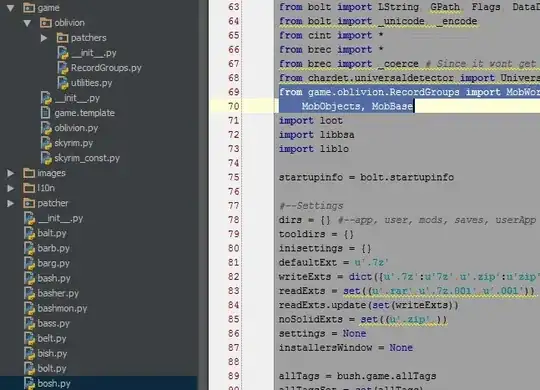
Note that the jsfiddle works in Internet Explorer 11. However, when I add this visualisation to the Qualtrics website it breaks in IE11. Far more SVG elements are added than there is data, as shown in the image below.
Note that this combination of Qualtrics and d3 visualisation works fine in Firefox, Chrome and Safari. Unfortunately the Qualtrics support team doesn't support custom code and I'm not proficient enough in javascript to track this down. Any ideas on what might cause this?
For this to work in Qualtrics:
- Add the d3.js library in the Qualtrics header
- Uncomment
Qualtrics.SurveyEngine.addOnload - Comment out
create_d3_interaction(false);
Update 1
I've debugged this a bit more.
In the update_svg_node method I do a selection of the SVG element:
var svg = d3.select('.' + svg_class);
var nodes = svg.selectAll('.' + class_id)
    .data(f.nodes());
The problem seems to occur in the selectAll -- for some reason it is not matching the class selection with the data. Note this only happens in Qualtrics and IE11 but works fine in IE11 in the fiddle. Note this is an updated version of the fiddle, but the problem still occurs the same way.
So nodes that should be in the UPDATE class are in the ENTER class for some reason.