2

My data file has just two columns.The following MWE on those columns produces boxes with repeated colors. Is it possible to produce unique colors for each box?

reset
set term postscript eps size 5.5,4.5 enhanced color solid lw 2\
font "arial,28"
set key right
set xtics rotate -45 font ",20"
set style fill solid 1 border -1
plot 'rankdefcount.dat' using ($0):2:($0):xticlabels(1) \
                                          notitle w boxes lc variable 
quit

Here is the output I got:

Output

Jey
  • 590
  • 1
  • 5
  • 18

2 Answers2

3

After few attempts and help from the SO experts, I came up with the following solutions; none of them perfect, though.

Solution 1: ( with a random repetition using rand and rgb calls)

reset
set term postscript eps size 5.5,4.5 enhanced color solid lw 2 font \
"arial,28"
set key right
rgb(r,g,b)=int(255*r)*65536+int(255*g)*256+int(255*b)
do for [i=1:31] {
   myrand=rand(int(rand(0)*i*100)+i*100)
   set style line i linecolor rgb rgb(rand(0),rand(0),rand(0))
}
set xtics rotate -45 font ",20"
set style fill solid 1 border -1
plot 'rankdefcount.dat' using ($0):2:($0):xticlabels(1) \
                                          notitle w boxes lc variable 
quit

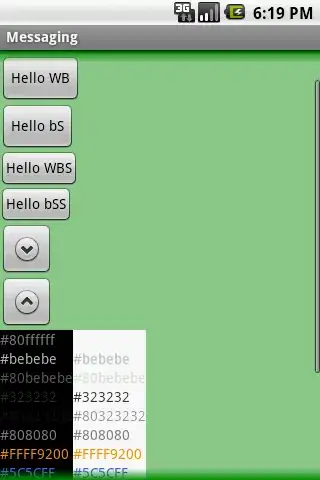
Here is the corresponding output:

rgb output

With palette definition (solution 2):

reset
set term postscript eps size 5.5,4.5 enhanced color solid lw 2 font \
"arial,28"
set key right
set palette color model HSV
set palette defined (0 0 1 1,1 1 1 1)
set palette defined ( 0 0 1 0, 1 0 1 1, 6 0.8333 1 1, 7 0.8333 0 1)
set boxwidth 0.5
unset colorbox
set xtics rotate -45 font ",20"
set style fill solid 1 border -1
plot 'rankdefcount.dat' using ($0):2:($0):xticlabels(1) \
                                          notitle w boxes lc palette 
quit

This is the output:

pal-redstart

For another solution (solution 3), replace the definition above with the following lines:

set palette color model HSV
set pm3d explicit at b
set palette rgbformulae 3, 2, 2

This is what I got:

pal-yellow

Jey
  • 590
  • 1
  • 5
  • 18
1

You may try and redefine as much linetypes as boxes you want to show. The code should go before the plot.

colors="black red orange #fa8072 ...." #[as much colors as needed] 
do for [L=1:words(colors)]{
set linetype L lc rgb word(colors,L)  
}

You can find colors for gnuplot here.

http://www.uni-hamburg.de/Wiss/FB/15/Sustainability/schneider/gnuplot/colors.htm

jmmo
  • 122
  • 8
  • Thanks. I am looking for a solution where I don't have to type the color names manually since the number of boxes is variable in my case. I have a solution using 'set palette' and 'lc palette' but that does not give me unique colors but only a gradient. Ideally, the solution would have a combination of rand and rgb calls. With my limited knowledge of gnuplot, I could not construct one successfully. – Jey Apr 15 '15 at 17:55
  • If you get into palettes read http://gnuplot.sourceforge.net/demo_5.0/pm3dcolors.html Also take advantage of the following command `set palette maxcolors N` Wisely choosing the palette and the maxcolors make the palette looks less gradient-like and more independent color-like. – jmmo Apr 15 '15 at 21:18
  • On the other hand in your output one can observe nine colors operating in a cycle. This is controlled by the command `set linetype cycle INTEGER` By increasing the cycle you may get more colors in you plot. – jmmo Apr 15 '15 at 21:44