I am trying to display data on a bar chart using angular-chart. I am trying retrieving the data from a database. I want to display all data on the chart for the last five (5) years including this year and also get the data to correspond with the years. So far I am only using 2 yrs, as shown below.
Json Array
Angularjs
app.controller('ChartCtrl', ['$scope', '$http', function ($scope, $http) {

  var currentYear = new Date().getFullYear();
  var allYrs = [];

  // get data from database
  $http.get('/dashboard/incident').success(function(incidents) {
    $scope.incidentCnt = incidents;
    console.log($scope.incidentCnt);

    for (var i = 0; $scope.incidentCnt.length; i++) {

      // Gets the current year and last 4 years (5 yrs total)
      for(var year = currentYear; year >= currentYear-4; year--) {

        allYrs.push(year);
        $scope.labels = allYrs; // display years

        $scope.series = [
          'Aggravated Assault',
          'Arson',
          'Burglary',
          'Forcible Sex Offense',
          'Hate Crime',
          'Motor Vehicle Theft',
          'Murder or Non-Negligent Manslaughter',
          'Negligent Manslaughter',
          'Non-Forcible Sex Offense',
          'Relationship/Dating Violence',
          'Robbery',
          'Stalking'
        ];

        $scope.data = [
           [
            $scope.incidentCnt[i].assault,
            $scope.incidentCnt[i].arson,
            $scope.incidentCnt[i].burglary,
            $scope.incidentCnt[i].fSexOffense,
            $scope.incidentCnt[i].hateCrime,
            $scope.incidentCnt[i].vehicleTheft,
            $scope.incidentCnt[i].nonNegligentMaslaughter,
            $scope.incidentCnt[i].negligentMaslaughter,
            $scope.incidentCnt[i].nonForcibleSexOffense,
            $scope.incidentCnt[i].rshipDatingViolence,
            $scope.incidentCnt[i].robbery,
            $scope.incidentCnt[i].stalking
           ]
         ];
      }
    };
  });

}]);
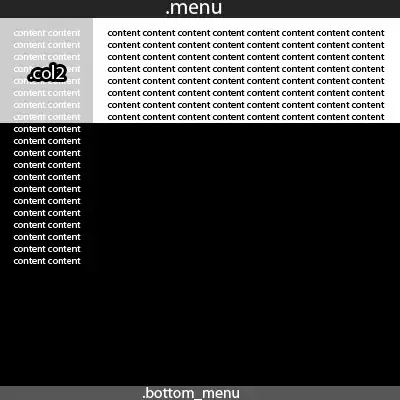
Chart's current look
Any help would be much appreciated. Thank you...