I would like to embed an activity graph created by hgactivity inside my hgweb webinterface. What's the best method to do so?
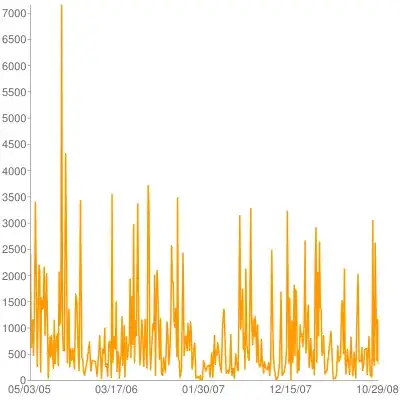
Here's a screenshot of a hgactivity graph:

It shows the number of commits through time to a Mercurial repository.
I would like to embed an activity graph created by hgactivity inside my hgweb webinterface. What's the best method to do so?
Here's a screenshot of a hgactivity graph:
It shows the number of commits through time to a Mercurial repository.
The difficulty you'll have is where to put the chart so it can be served. If you're okay with having a standard view that everyone sees you could use a cron job to run hg activity and save the image to a standard filename in with the hgweb static files (the css, etc.). Then just tweak your hgweb template to include an img tag that references the image file. If your cron job is overwriting that file periodically (daily, hourly?) you'll be good to go.
If you need something more dynamic (user specific queries, particular date ranges, etc.) you might want to look at (my) hg chart extension. It's not as full features as hg activity but it does have the advantage of spitting out google chart API urls rather than image files. Example:
https://chart.apis.google.com/chart?cht=lxy&chs=400x400&chd=e:AAAKAaAjAtA6BHBQBaBkBtB3CACKCUChCqC0C9DHDRDaDkDuD3EBEOEXEhExE7FIFRFbFlFuF4GBGOGeGyG7HFHOHbHlHyIFIVIiIyI8JMJcJlJyJ8KcK2LGLWL8MQMwNDNTNgNqNzOAONOaOjOtO3PAPKPUPdPnPwP6QEQNQXQhQqQ0Q-RORXRnR0SBSLSUSeSrS0S-TITRTeTuT7UIUVUeUoU1VFVPVbVoVyV8WFWPWYWiWsW1W.XJXSXcXmXvX5YGYSYfYpYzY8ZGZTZcZpZzZ8aGaQaZajata6bDbNbWbgbwcDcQcacjc0c9dHdQdadkdtd3eBeNeae3fEfOfXfnf0gOgegug4hBhVhhhrh1h-iIiSibiliyjFjVjlj.kSkckpk1lClSlflvmDmMmWmfmpmznAnJnTncnmnwn5oDoNoWogoqo2pApKpTpdpnpwp9qHqUqdqnq3rArRrkr0r-sKsXshsqs0tLtbtkt0uEuRuou7vFvOvYvivrv4wFwPwfwowyw7xFxPxYxlxvx4yFyVyfypyyy8zGzPzZzizsz20D0M0W0g0p0z081J1T1d1m1w152J2g3Q3q3z4E4Q4g4t5B5K5U5k5u536B6R6r677E7R7h707-8O8b8l8x879F9S9b9o9y97-P-f-o-y-8.F.P.Y.i.s.1..,VnFsKVETK.eWNyCaLTTrSnBdN.MKMVTTHuL8SLLBAbENHZD.HrE8CEKSC1G1H9CiSeJiMb..ItFLFDmnDBIhMKCVFcDbFaCAOuNUEsBtepD3DuBTA6DfGjBoDdDLAuHpAVFWEjI5CYCzAtGWGqFTAhfrDFGxHbFVNZBjE7EBAbDjEaK2CjJXAnHeDpFyGhRSD2OWGJajC.KGHreDISCqGtKVHUCZKbFtCHhId8GrB2EpHRJqItR5A5OSSrOJHgDpKmBHA4D2C1BbE4KBHbCtFHKQW7QpQuKRJDMSEGfDDrDZAeB2VqEPGkHlFHJrHuFFJ-IcB5DQFaGZAaArATA4AJALDaBmCTCkCoAlEtAkEPHpCwE.ETGbFfC9BZJtMJBNBwBPCZHzA3CEAUEiCBBqPdcDIwLnPjFPH3B9S-GNFbDqDaOfdOKcGDKaHeK8IODGJdDXCUCdHADbBQDKCIB1DGAzDCWKLREaCGAFAeA7DEPCA0BZC5FSc0OTC9N7ANKGDGQMEPPfN.BSFHBwJeHiH-FvJlXxEuF1K-M0COEbHHDfB-FKA-TpaADISdHoXiMUMGETE2HnBFBqIYAVATAWA2F5DOEELxNmElS-EDBFFRBBHaEFAyE2AbI9SHDKDSDSFqBtCyFQFZFeBCHhAuCKAibPDlCjXXMRDYKXCq&chxt=y,x&chxl=1:%7c05/03/05%7c03/17/06%7c01/30/07%7c12/15/07%7c10/29/08&chxr=0,0,7166
which looks like:
Then there are no files to save or serve. You tweak your template to invoke a little code that runs hg chart, insert the URL into the page's HTML, and let google create and serve the image.
I came up with the following setup:
Add a folder activity to the template static
Add a changegroup hook called activity in hgwebconfig:
[hooks]
changegroup.activity = hg activity --filename /usr/share/mercurial/templates/static/activity/${PWD##*/}.png
The ${PWD##*/} will be replaced by the folder name of the repository (a hook script is run in the root of a repository). Upon triggering (push or pull of one or more changesets) an activity graph is placed in the static/activity folder of the (default) template folder.
Now you can add the following HTML to the template page of your preference
<img src="{staticurl}/activity/{repo}.png"/>
This will load the most recent activity graph for the current repository.
Caveat: You need at least one push after activation of this hook before the image is created.
I started a project that has this build in. You can see a demo on http://hg.python-works.com it's pylons based and have activity graph.