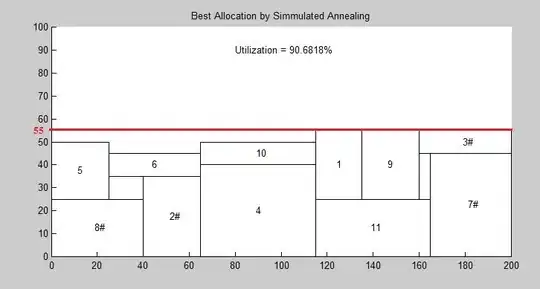
If you're interested in determining the total "area" underneath the red line, one suggestion I have is if you have access to the Image Processing Toolbox, simply create a binary image where we draw all of the rectangles on the image at once, fill all of the holes, then to determine the area, just determine the total sum of all of the binary "pixels" in the image. You said you have the (x,y) positions of the bottom-left corner of each rectangle, as well as the width and height of each rectangle. To make this compatible in an image context, the y axis is usually flipped so that the top-left corner of the space is the origin instead of the bottom-left. However, this shouldn't affect our analysis as we are simply reflecting the whole 2D space downwards.
Therefore, I would start with a blank image that is the same size as the grid you are dealing with, then writing a loop that simply sets a rectangular grid of coordinates to true for each rectangle you have. After, use imfill to fill in any of the holes in the image, then calculate the total sum of the pixels to get the area. The definition of a hole in an image processing context is any black pixels that are completely surrounded by white pixels. Therefore, should we have gaps that are surrounded by white pixels, these will get filled in with white.
Therefore, assuming that we have four separate variables of x, y, width and height that are N elements long, where N is the number of rectangles you have, do something like this:
N = numel(x); %// Determine total number of rectangles
rows = 100; cols = 200; %// Define dimensions of grid here
im = false(rows, cols); %// Declare blank image

%// For each rectangle we have...
for idx = 1 : N
    %// Set interior of rectangle at location all to true
    im(y(idx)+1:y(idx)+height(idx), x(idx)+1:x(idx)+width(idx)) = true;
end

%// Fill in the holes
im_filled = imfill(im, 'holes');

%// Determine total area
ar = sum(im_filled(:));
The indexing in the for loop:
im(y(idx)+1:y(idx)+height(idx), x(idx)+1:x(idx)+width(idx)) = true;
Is a bit tricky to deal with. Bear in mind that I'm assuming that y accesses the rows of the image and x accesses the columns. I'm also assuming that x and y are 0-based, so the origin is at (0,0). Because we access arrays and matrices in MATLAB starting at 1, we need to offset the coordinates by 1. Now, the beginning index for the row starts from y(idx)+1. We end at y(idx) + height(idx) because we technically start at y(idx)+1 but then we need to go up to height(idx) but then we also subtract by 1 as your coordinates begin at 0. Take for example a line with the width of 20, from x = 0 to x = 19. This width is 20, but we draw from 0, up to 20-1 which is 19. Because of the indexing starting at 1 for MATLAB, and the subtraction of 1 due to the 0 indexing, the +1 and -1 cancel, which is why we are just left with y(idx) + height(idx). The same can be said with the x coordinate and the width.
Once we draw all of the rectangles in the image, we use imfill to fill up the holes, then we can sum up the total area by just unrolling the whole image into a single vector and invoking sum. This should (hopefully) get what you need.
Now, if you want to find the area without the filled in holes (I suspect this is what you actually need), then you can skip the imfill step. Simply apply the sum on the im, instead of im_filled, and so:
ar = sum(im(:));
This will sum up all of the "white" pixels in the image, which is effectively the area. I'm not sure what you're actually after, so use one or the other depending on your needs.


