Most of financial chart libraries use some rules for coloring the candles:
- if
close >= open, then candle ishollow(not filled) - if
close < open, then candle isfilled - if
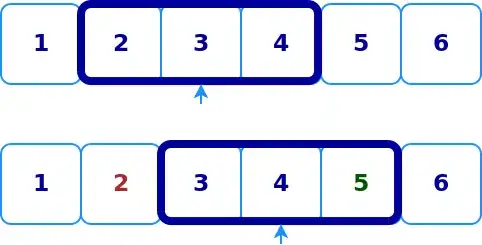
previous close <= close, then candle isgreen - if
previous close > close, then candle isred
jFreeChart seems to have own rules for coloring and it's possible to change them. By default the chart looks something like this (some colors has been changed):
So as you see, it is possible to change the colors of candles, background, plot borders etc.
I'd like to implement rules 1 and 2 (above) to the chart. Is it possible?
The result should be like this:

This is my current CandlestickRenderer used in the example:
public class CandlestickRenderer extends org.jfree.chart.renderer.xy.CandlestickRenderer {

    public CandlestickRenderer() {
        setDrawVolume(false);
    }

    @Override
    public Paint getItemPaint(int series, int item) {
        OHLCDataset highLowData = (OHLCDataset)getPlot().getDataset(series);
        Number curClose = highLowData.getClose(series, item);
        Number prevClose = highLowData.getClose(series, item>0 ? item-1 : 0);
        if (prevClose.doubleValue() <=  curClose.doubleValue()) {
            return getUpPaint();
        }
        else {
            return getDownPaint();
        }
    }
}
Update 1
It seems it can be done just by setting up paint to black and draw item pant unchanged with colors.
public class CandlestickRenderer extends org.jfree.chart.renderer.xy.CandlestickRenderer {

    public CandlestickRenderer() {
        setDrawVolume(false);
        setUseOutlinePaint(false);
        setUpPaint(Color.BLACK); // <-- rule 1. (plot is also black so it looks not filled)
    }

    @Override
    public Paint getItemPaint(int series, int item) {
        OHLCDataset highLowData = (OHLCDataset) getPlot().getDataset(series);
        Number curClose = highLowData.getClose(series, item);
        Number prevClose = highLowData.getClose(series, item>0 ? item-1 : 0);

        if (prevClose.doubleValue() <=  curClose.doubleValue()) {
            return Color.GREEN; // <-- rule 3.
        } else {
            return Color.RED; // <-- rule 4.
        }
    }

}
But the main question lasts:
What does it mean
down (downPaint)andup (upPaint)according jFreeChart? Does it compareprev. close vs. closevalues oropen vs. close?Where in the source of jFreeChart can I find the part where
upPaint&downPaintare used?
This is the strange result now: