from my previous question here Creating Variables with Group in R igraph, I want to put the vertices with the same group/color close together in my type of data just like this one https://lists.nongnu.org/archive/html/igraph-help/2012-03/pngFA9V_3yRcA.png. Thanks in advance
Asked
Active
Viewed 2,968 times
0
-
Have you defined groups? If yes, use `edge.color` and you're done. – Roman Luštrik Feb 24 '15 at 11:08
-
I used edge.color in the past, it just colour the line. What I need is set the coordinates of items with same group close together – jbest Feb 24 '15 at 11:20
-
Gah, I meant `vertex.color`. I think what you may be looking for is a clustering algorithm to assign group membership to. – Roman Luštrik Feb 24 '15 at 12:30
-
already tried that one, yeah I am looking for something like that or just something to help me with the coordinates of the vertices in the plot – jbest Feb 24 '15 at 12:33
-
What about this? http://stackoverflow.com/questions/21095643/approaches-for-spatial-geodesic-latitude-longitude-clustering-in-r-with-geodesic – Roman Luštrik Feb 24 '15 at 12:36
1 Answers
3
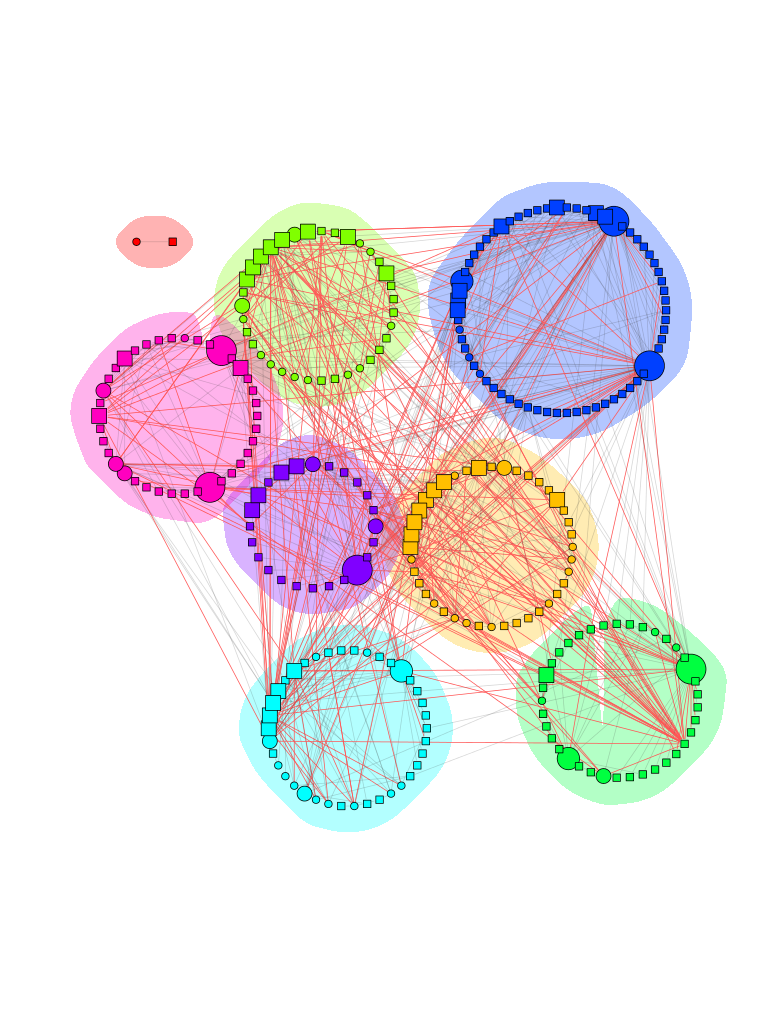
I have implemented such a function in my package NetPathMiner, called layoutVertexByAttribute.
library(igraph)
library(NetPathMiner)

g <- graph.data.frame(message)
g <- setAttribute(g, "sender", sender_country)

l = layoutVertexByAttr(g, "sender", cluster.strength=10, layout=layout.kamada.kawai)

plotNetwork(g, vertex.color="sender",layout=l)
You can look at the source code here or view the vignette for more details.

EDIT:
Since installing the package seems a bit difficult if you don't use Bioconductor, I will write a simpler version of the function here.
layout.by.attr <- function(graph, wc, cluster.strength=1,layout=layout.auto) {
        g <- graph.edgelist(get.edgelist(graph)) # create a lightweight copy of graph w/o the attributes.
        E(g)$weight <- 1

        attr <- cbind(id=1:vcount(g), val=wc)
        g <- g + vertices(unique(attr[,2])) + igraph::edges(unlist(t(attr)), weight=cluster.strength)

        l <- layout(g, weights=E(g)$weight)[1:vcount(graph),]
        return(l)
}
To use it with your example:
g <- graph.data.frame(message)

l = layoutVertexByAttr(g, sender_country, cluster.strength=10, layout=layout.kamada.kawai)

plot.igraph(g, vertex.color=sender_country, layout=l)
-
thanks for the answer but it seems that I can't download "NetPathMiner" for R version 3.1.2 – jbest Feb 24 '15 at 12:40
-
you can use `devtools` : `library(devtools); install_github(repo="NetPathMiner", username="ahmohamed") ` – ahmohamed Feb 24 '15 at 12:41
-
or from bioconductor: `source("http://bioconductor.org/biocLite.R"); biocLite("NetPathMiner")` – ahmohamed Feb 24 '15 at 12:43
-
your source take too long to load and I have to cancel it and what I need is all the graphs of the same colour to be together. Thanks for the help but I think I'll other algorithms – jbest Feb 24 '15 at 13:07
-
1I have exported the layout function. You can just copy and paste it in your R console to use. – ahmohamed Feb 25 '15 at 15:21
-
@admohamed I have been trying to get your code now for week but I keep getting this error `Error in dyn.load(file, DLLpath = DLLpath, ...) : unable to load shared object '/Applications/brianR/NetPathMiner/libs/NetPathMiner.so': dlopen(/Applications/brianR/NetPathMiner/libs/NetPathMiner.so, 6): Library not loaded: /usr/local/lib/libsbml.5.dylib Referenced from: /Applications/brianR/NetPathMiner/libs/NetPathMiner.so Reason: image not found Error: package or namespace load failed for ‘NetPathMiner’` when I do `library(NetPathMiner` – jbest Mar 03 '15 at 09:33
-
First, the code I posted after the edit, `layout.by.attr` doesn't require NetPathMiner to be installed. You can just copy the function and paste it in your console, and you are ready. – ahmohamed Mar 03 '15 at 10:44
-
Second, NetPathMiner installation from binaries use some libraries (`libxml2`, and `libsbml`) which are used for biological applications. Since this is not your target, you can install NetPathMiner from source using `biocLite("NetPathMiner", source=TRUE)`. Let me know if you still have problems with it. – ahmohamed Mar 03 '15 at 10:47
-
Also, refer to my answer in this [question](http://stackoverflow.com/questions/28715736/how-to-spread-out-community-graph-made-by-using-igraph-package-in-r) for detailed explanation on how the layout works. – ahmohamed Mar 03 '15 at 10:50
-
yes, but I cannot find the code for `getAttribute` and `setAttribute`.Thank you – jbest Mar 03 '15 at 10:55
-
You don't need it any more. I edited the answer to show how to use the function. – ahmohamed Mar 03 '15 at 11:00
-
I did `l = layoutVertexByAttr(g, sender_country, cluster.strength=10, layout=layout.kamada.kawai) plot.igraph(g, vertex.color=sender_country, layout=l)` but got an error of `Error in cbind(id = 1:vcount(g), val = wc[[i]]) : object 'i' not found` – jbest Mar 03 '15 at 11:59
-
Let us [continue this discussion in chat](http://chat.stackoverflow.com/rooms/72135/discussion-between-jbest-and-ahmohamed). – jbest Mar 03 '15 at 12:02