2

Default axes are very thin in Matlab plots and I tried to make them bold with

set(gca, 'fontsize', 18, 'linewidth', 2)

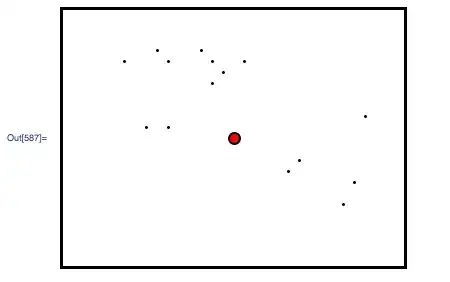
But the lines do not match properly together in the four edges. The following MWE demonstrates the problem:

plot(1,1,'linewidth', 5)
set(gca, 'fontsize', 18, 'linewidth', 5)
box on
print -dpng example

example with glitch in the edges

How can I draw bold axes properly in Matlab?

Jonas Stein
  • 6,826
  • 7
  • 40
  • 72

1 Answers1

3

How about drawing the four thick lines manually with plot?

plot(1,1,'linewidth', 5)
hold on
xl = xlim;
yl = ylim;
plot([xl(1) xl(2) xl(2) xl(1) xl(1)],...
     [yl(1) yl(1) yl(2) yl(2) yl(1)],....
     'k', 'linewidth', 5)
set(gca, 'fontsize', 18)
print -dpng example

Or, as noted by @thewaywewalk, that long plot line can be replaced by the simpler

rectangle('linewidth',5)

Result in Matlab R2010b:

enter image description here

Result in Matlab R2014a: enter image description here

Result in Matlab R2014b:

enter image description here

Luis Mendo
  • 110,752
  • 13
  • 76
  • 147
  • For any reason your solution is not working for me (Matlab 2014a with HG2-Update), it looks the same like in the OPs case. Apart from that: just simply `rectangle('linewidth',5)` would do the job as well, as default the rectangle is drawn regarding the axes limits. But anyhow, with the same issue the OP describes. – Robert Seifert Feb 24 '15 at 10:41
  • to be on the save side you could add `'marker','s','MarkerFaceColor','k','MarkerEdgeColor','none'` to your `plot` command, not working with the rectangle command though, at least not in this version. – Robert Seifert Feb 24 '15 at 10:50
  • @thewaywewalk Thanks for the comments. I've edited my answer to include the `rectangle` line. It's weird you get the wrong behaviour, because the OP edited my answer with his results in R2014a and it seems to work. Maybe it's the hg2 update – Luis Mendo Feb 24 '15 at 12:19