I have three 2d arrays: X,Y,Z, which contain irregular 3d points coordinate,respectively.And another 2d array data, which contains the values on those points. What I want to do is to display this data in 3d space , with 0 value part masked out.Much like this one:
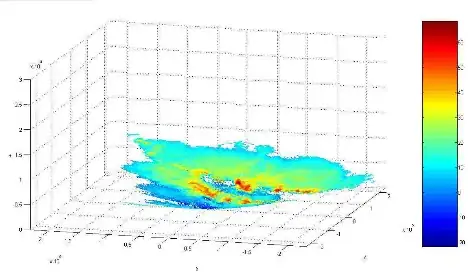
In matlab, I can use function fill3 to achieve this, but how can I plot the same kind of picture in matplotlib or mayavi ? I have tried to use mask array ,plot_surface and colorface together, as the example here: Plotting a masked surface plot using python, numpy and matplotlib
and it worked, the result is the link below:
 but that is really really slow, and will cost too much time. Is there a better way?