0

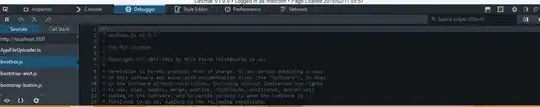
I can't find and set breakpoints for inline javascript that is included in the HTML file. Under debugger->sources it just lists all the external .js files that are loaded for debugging. Where can I find the inline javascript that is in the html? Below you can see it only lists sources which are external js files that are loaded. When I say inline, I mean javascript included between <script type="text/javascript"></script> tages Only external js files are included under sources

Note: I know I can use Firebug, but that is not the solution I am looking for.

k29
  • 641
  • 6
  • 26

3 Answers3

0

Assuming the inline scripts are parsed and run, they'll show up in the list of sources using the page name (e.g., foo.html or similar). If you don't see them there, hit F5. If you still don't, it may be that an error prior to them has prevented them from being parsed and run.

For instance, here I have scratchpad.html with script.js, anotherscript.js, and an inline block:

enter image description here

T.J. Crowder
  • 1,031,962
  • 187
  • 1,923
  • 1,875
0
  • Select http://localhost:3000
  • Find the snippet you want to debug.
  • Click the line number where you want to place the breakpoint.

Nice. You just set a breakpoint in your embedded JS.

Assuming that http://localhost:3000 shows you the html you loaded. If not, there will be some tab in that list which does that.

Praveen Puglia
  • 5,577
  • 5
  • 34
  • 68
0

There is a 'prettify source' option in the Sources pane, click that and then add the breakpoint.

Vijayanand Settin
  • 826
  • 11
  • 13