I have a chart where the x Axis represents calendarweeks. Because of the change of the year my chart is now not right sorted. So the calendarweek 1 from 2015 is now before the calendarweeks from 2014.
I know that I have to change something in my data. I thought of adding the year before the calendarweek like 151, 152, 1450, 1451, 1452 and so on.
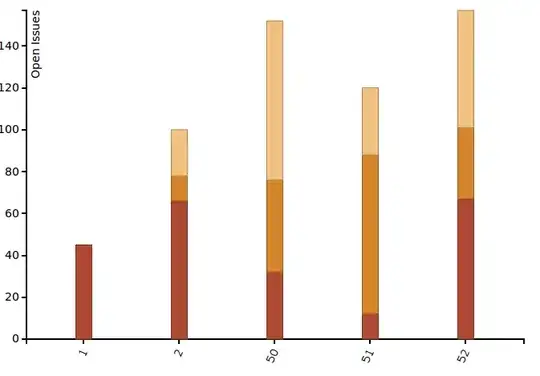
I tried this and it works. But it is not really readable then for the customer. So I thought I could just parse the calendarweek number to 1, 2, 50, 51 and 52 again and send it to the xAxis variable.
var xAxis = d3.svg.axis()
.scale(x)
.tickValues(sliceKeys)
.orient("bottom");
But then it happens that the ticks won't match with the bars and don't appear. But the bars are right sorted now. Does anybody has an idea how this could be done?