2

A while back I posted an issue relating to an issue I was having relating to CFThread exceeding GC Overhead limit (Note: someone marked a response as the answer but the issue has never been resolved).

After months and months of reading and taking different approaches to try and implement a working solution I'm still no further forward.

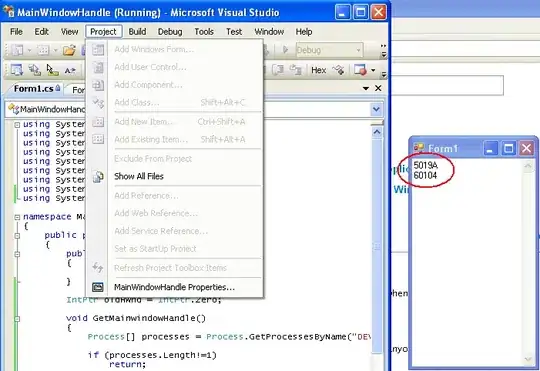
Most recently I've started trying to use the MAT plugin within Eclipse to determine if I'm encountering my issue due to a memory leak issue, however I do not understand the information that is being displayed to me.

Can anyone analyse what is being displayed below please?
enter image description here enter image description here enter image description here

Do I have a memory leak issue that needs addressed? And is it likely this is what is causing my CPU usage to get maxed out and the CF service (and eventually the system) come to a standstill?

CPB07
  • 679
  • 3
  • 13
  • 23
  • 1
    When our CPU get's maxed out, it's almost always due to some less than ideal code we put there. The link you provided as a reference alluded to threads being generated inside a loop. We've had a similar issue with ldap calls inside a loop (each call created a new thread). Another issue we've experienced more than once is the combination of long running queries with multiple page requests by the same user. – Dan Bracuk Jan 16 '15 at 13:36
  • 1
    So you know this is cfthread that might be causing this. You think you have a memory leak. Maybe you have to many concurrent live threads and exponentially hammering the server with loops on top of that. I have done something similar like this before. Check this answer. https://forums.adobe.com/message/6655823#6655823 then read the whole thread. – Frank Tudor Jan 16 '15 at 13:40
  • 1
    There's no useful information in what you're showing us there as there's nothing that identifies *what* is using the memory. Something like jvisualvm will let you drill down into the used memory and see what's using it. – Adam Cameron Jan 16 '15 at 13:56
  • @DanBracuk Did you ever manage to resolve the issue you were encountering? – CPB07 Jan 16 '15 at 15:02
  • @FrankTudor That is the post I had posted on the Adobe forums but was getting nowhere unfortunately. The strange thing is that I could be running 10 threads or 100 threads but the same issue occurs and it does not appear as if it is a gradual build-up of CPU usage, it'll be fine one minute then suddenly the CPU usage spikes. There doesn't seem to be any pattern, sometimes the threads can run for an hour no issues other times they run for a couple minutes before the CPU usage starts spiking... – CPB07 Jan 16 '15 at 15:06
  • For mulitple page requests, we have a custom tag that covers submit buttons and hyperlinks that we hope all developers use. The ldap thing we fixed with a band-aid solution. – Dan Bracuk Jan 16 '15 at 17:37
  • Do you still continue to create a thread for each user through each loop iteration? I'm wondering if there's a better way to achieve what I'm doing currently but am hitting my head against a wall trying to think of one! – CPB07 Jan 19 '15 at 16:46
  • If possible i would test this code on coldfusion 11. In my experience it handles memory issues better. – Nebu Jan 21 '15 at 11:14
  • It is CF11 I'm running this app on. – CPB07 Jan 21 '15 at 11:28
  • Perhaps old school debugging can solve this issue. Remove blocks of codes run the app and see if the problem still exists. If so repeat this process until you have discovered which part of your code is generating the problem. – Nebu Jan 21 '15 at 11:38

0 Answers0