17

Here's my code:

#data
sites <- 
  structure(list(site = c(928L, 928L, 928L, 928L, 928L, 928L, 928L,
                          928L, 928L, 928L, 928L, 928L, 928L, 928L,
                          928L, 928L, 928L, 928L, 928L, 928L, 928L,
                          928L, 928L, 928L, 928L, 928L), 
                 date = c(13493L, 13534L, 13566L, 13611L, 13723L,
                          13752L, 13804L, 13837L, 13927L, 14028L,
                          14082L, 14122L, 14150L, 14182L, 14199L,
                          16198L, 16279L, 16607L, 16945L, 17545L,
                          17650L, 17743L, 17868L, 17941L, 18017L, 18092L),
                 y = c(7L, 7L, 17L, 18L, 17L, 17L, 10L, 3L, 17L, 24L, 
                       11L, 5L, 5L, 3L, 5L, 14L, 2L, 9L, 9L, 4L, 7L,
                       6L, 1L, 0L, 5L, 0L)), 
            .Names = c("site", "date", "y"),
            class = "data.frame", row.names = c(NA, -26L))

#convert to date
x<-as.Date(sites$date, origin="1960-01-01") 

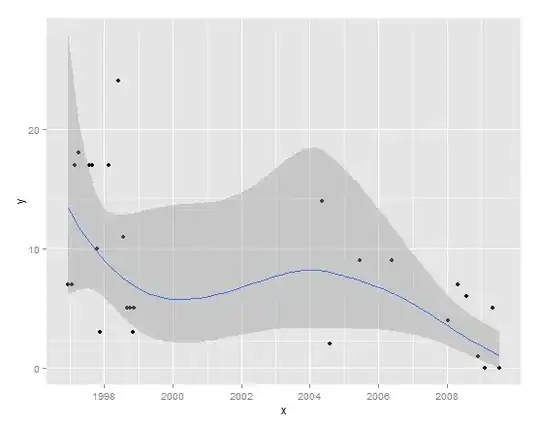
#plot smooth, line goes below zero!
qplot(data=sites, x, y, main="Site 349") 
(p <- qplot(data = sites, x, y, xlab = "", ylab = ""))
(p1 <- p + geom_smooth(method = "loess",span=0.5, size = 1.5))

Some of the LOESS lines and confidence intervals go below zero, I would like to restrict the graphics to 0 and positive numbers (because negative do not make sense). enter image description here

How can I do this?

zx8754
  • 52,746
  • 12
  • 114
  • 209
Nate
  • 171
  • 1
  • 3

2 Answers2

17

I am seconding Matt Parker's suggestion that you have to change the fitting procedure. One option that often works for positive-only data, is to do the fit on log-scale, and then exponentiate to get results on the original scale. This will guarantee positive only values.

Generating random data that has some of this issues:

 d <- data.frame(x=0:100)
 d$y <- exp(rnorm(nrow(d), mean=-d$x/40, sd=0.8))
 qplot(x,y,data=d) + stat_smooth() 

Now we can use ggplot's transformation capabilites to log-transform the y-values, but display the results on an exponential scale (which corresponds to the original one):

qplot(x,y,data=d) + stat_smooth() + scale_y_log10()+coord_trans(ytrans="pow10")

You can see examples like this on the coord_trans help page. If you don't like the y-axis, you can manipulate the breaks and labels.

EDIT based on the question update

There have been some changes in ggplot2 since the question was originally asked, and the original answer did not deal with 0's.

Option 1

The main idea of the solution is the same: find a transformation that will map the range of possible values to -Inf to Inf, do the loess smooth there, and then backtransform the result. The log-transformation would be great if there were no zeroes. I don't think the required function exists if 0 is included, but a possibility that often works is the log(1+x) transformation. That is built-in, but we need to have the inverse transformation exp(x)-1 as well.

library(scales)
#create exp(x)-1 transformation, the inverse of log(1+p)
expm1_trans <-  function() trans_new("expm1", "expm1", "log1p")

qplot(x, y, data=sites) + stat_smooth(method="loess") +
  scale_y_continuous(trans=log1p_trans()) +
  coord_trans(ytrans=expm1_trans())

Loess fit on log(1+x) transformed data

Option 2

The second option extends the suggestion in the comments to Matt Parker's answer: use a regression method that incorporates the integer nature of the outcomes. That means overdispersed (just in case) Poisson regression for counts. While you can't do loess, you can do a spline fit. You can play with the degrees of freedom to control the smoothness.

library(splines)
qplot(x, y, data=sites) + stat_smooth(method="glm", family="quasipoisson", 
                                      formula = y ~ ns(x, 3))

Spline fit using overdispersed Poisson regression

The two options give quite similar results, which is a good thing.

Richard
  • 56,349
  • 34
  • 180
  • 251
Aniko
  • 18,516
  • 4
  • 48
  • 45
  • Aniko, I get this error in trying this: Error: NA/NaN/Inf in foreign function call (arg 1) – Nate May 07 '10 at 21:25
  • 1
    @Nate: You get the "NA/NaN/Inf ..." error if you have zeros among the y values. Since log(0) is undefined, this is not surprising. This method works only for _positive_ values. Depending on the context (eg. if `y` gives counts), you might use `y+1` instead of `y`, but it's getting messy. – Aniko May 10 '10 at 14:00
  • Ah that makes sense. I ended up going with a GAM smooth (library mgcv) which works...so I think I'll stick with it. Thank you all for your responses. – Nate May 10 '10 at 21:00
  • @Aniko I edited the question, added data and plot. Could you edit your answer, `+coord_trans(ytrans="pow10")` part doesn't work for me... – zx8754 Aug 12 '14 at 09:44
  • @zx8754 The examples on the help page for `coord_trans` shows how to do this. Try `ytrans = exp_trans(10)`. – aosmith Aug 14 '14 at 17:56
  • 1
    For option 2, I get "Error: Unknown parameters: family" – mhwombat Mar 28 '17 at 10:42
  • method.args have been updated see ?stat_smooth. Needs to be a list. – bw4sz Jun 01 '18 at 16:52
  • `Error: `ytrans` arguments is deprecated; please use `y` instead. (Defunct; last used in version 1.0.1)` for tidyverse 1.3.0. I just used `y` and it was fine. Thanks! – dfrankow Mar 07 '20 at 20:16
4

I can't test it without some example data, but

qplot(data=sites, x, y, main="Site 349")  
(p <- qplot(data = sites, x, y, xlab = "", ylab = "")) 
(p1 <- p + geom_smooth(method = "loess",span=0.5, size = 1.5)) 
p1 + theme_bw() + opts(title = "Site 349") + ylim(0, foo)

(where foo is a suitable upper limit for your plot) might do the trick. Unlike in base graphics, the xlim() and ylim() commands in ggplot actually restrict the data that are used in making the plot, rather than just the plot window. It might also restrict the geom_smooth() (though I'm not certain).

Edit: After reading a bit more, you might also want to consider switching out the model that geom_smooth is using. Again, not being able to see your data is a problem. But, for example, if it's binary - you can add stat_smooth(method="glm", family="binomial") to get a logit-smoothed line. See ?stat_smooth for more.

Matt Parker
  • 26,709
  • 7
  • 54
  • 72
  • Here's an example of the data I am using. y are count observations of a population. I convert the date with: x<-as.Date(sites$date, origin="1960-01-01") site date y 1 1164 13549 3 9 1164 13815 20 11 1164 13928 24 13 1164 13998 28 14 1164 14047 31 40 1164 15211 28 41 1164 15273 7 42 1164 15306 13 43 1164 15371 3 44 1164 15544 0 45 1164 15642 3 46 1164 15733 0 47 1164 15819 5 48 1164 16005 0 49 1164 16082 2 50 1164 16187 7 51 1164 16268 3 52 1164 16366 1 53 1164 16455 2 54 1164 16555 2 56 1164 16730 0 57 1164 16831 0 58 1164 16933 1 59 1164 16989 1 60 1164 17092 1 – Nate May 07 '10 at 15:32
  • Oof. That's not much help. Use the function `dput()` to convert your example data frame into a text representation, then edit your answer above. See my recent question for an example: http://stackoverflow.com/questions/2789916/comparing-values-longitudinally-in-r-with-a-twist – Matt Parker May 07 '10 at 16:48
  • structure(list(site = c(928L, 928L, 928L, 928L, 928L, 928L, 928L, 928L, 928L, 928L, 928L, 928L, 928L, 928L, 928L, 928L, 928L, 928L, 928L, 928L, 928L, 928L, 928L, 928L, 928L, 928L), date = c(13493L, 13534L, 13566L, 13611L, 13723L, 13752L, 13804L, 13837L, 13927L, 14028L, 14082L, 14122L, 14150L, 14182L, 14199L, 16198L, 16279L, 16607L, 16945L, 17545L, 17650L, 17743L, 17868L, 17941L, 18017L, 18092L), y = c(7L, 7L, 17L, 18L, 17L, 17L, 10L, 3L, 17L, 24L, 11L, 5L, 5L, 3L, 5L, 14L, 2L, 9L, 9L, 4L, 7L, 6L, 1L, 0L, 5L, 0L)), .Names = c("site", "date", "y") – Nate May 07 '10 at 21:50
  • , class = "data.frame", row.names = c(NA, -26L)) – Nate May 07 '10 at 21:51
  • I convert dates with: x<-as.Date(sites$date, origin="1960-01-01") – Nate May 07 '10 at 21:52
  • Family would be poisson for GLM, but the CI seems much smaller and liner straighter than LOESS. It's arbitrary, but I'd like more squiggle as in the LOESS. Any thoughts? – Nate May 07 '10 at 21:54
  • None, unfortunately. The default model for `stat_smooth` is GAM, which I don't know much about. – Matt Parker May 07 '10 at 22:33