12

I am trying to get performance of individual functions within a process. How can I do it using perf tool? Is there any other tool for this?

For example, let's say, main function calls functions A , B , C . I want to get performance of main function as well as functions A,B,C individually .

Is there a good document for understating perf source code?

Thank you.

Bapi Sekh
  • 121
  • 1
  • 3
  • Try to think of it a little differently. Don't think about performance of functions. Think of what's happening in your program, that takes enough time to care about, that doesn't need to happen. That's what you are looking for. – Mike Dunlavey Jan 03 '15 at 00:15
  • ... For example, it could be that your program is spending 80% of it's time allocating memory for objects and later deleting them. No function in your program is performing badly. However, if you simply re-used objects (by keeping them in a free-list) instead of deleting and allocating them, you could get up to 5x increase in speed! – Mike Dunlavey Jan 03 '15 at 15:54
  • Have you tried using "perf record" and then "perf report" or "perf record -g" or "perf record -G" – Milind Dumbare Jan 03 '15 at 21:28

3 Answers3

5

What you want to do is user-land probing. Perf can only do part of it. Try sudo perf top -p [pid] and then watch the scoreboard. It will show the list of functions sorted by CPU usage. Here is an snapshort of redis during benchmark:
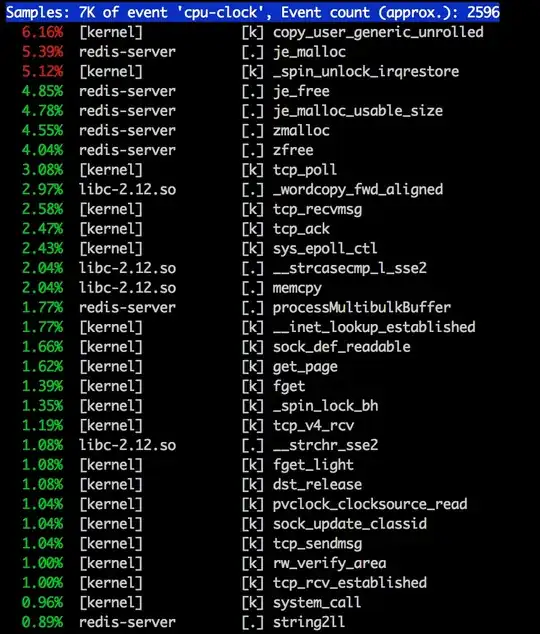
perf top profiling redis

If you want to get more infos of your user-land functions, such as IO usage, latency, memory usage, I strongly suggest you to use Systemtap. It is both scripting language and tool for profiling program on Linux kernel-based operation system. Here is a tutorial about it:

http://qqibrow.github.io/performance-profiling-with-systemtap/

And you don't need to be a expert of systemtap scripting, there are many good script online for you. For example, there is an example about using it to find out the latency of specific function.

https://github.com/openresty/stapxx#func-latency-distr

qqibrow
  • 2,942
  • 1
  • 24
  • 40
4

See the Perforator tool, which is built for this: https://github.com/zyedidia/perforator.

Perforator uses the same perf_event_open API that perf uses, but also uses ptrace so that profiling can be selectively enabled only for certain regions of a program (such as functions). See the examples at the Github repository for details.

Zach
  • 4,652
  • 18
  • 22
  • 1
    Cool, nice that someone put together a tool for that. But it's probably not going to work well for small functions called very often: enable / disable of a perf event has some overhead. The software-breakpoint it uses to gain control causes a debug exception so it drains the out-of-order back-end and store buffer. (There isn't really a better lower-overhead way to do this, other than just ignoring samples that are outside your region of interest which could work for perf-report type measurements but not well for perf-stat counting of totals.) – Peter Cordes Jan 05 '21 at 06:30
0

perf is documented at https://perf.wiki.kernel.org/index.php/Main_Page with a tutorial at https://perf.wiki.kernel.org/index.php/Tutorial

perf report gives the breakdown by "command", see https://perf.wiki.kernel.org/index.php/Tutorial#Sample_analysis_with_perf_report. perf annotate provides a way to select what commands to report, see "Source level analysis with perf annotate" in https://perf.wiki.kernel.org/index.php/Tutorial#Options_controlling_output_2.