I have 35 datasets and I plotted them in one chart using the following commands:
set output 'NC_006509.fna.pdf'
set xlabel "Position (kb)"
set ylabel "Identity (%)"
set size 1, 0.25
unset key
set xrange [0:4000]
set yrange [75:101]
filename(n) = sprintf("blast_sample%d_454LargeContigs.fna.fas_vs_NC_006509_filter.txt", n)
plot for [i=1:35] filename(i) using ($9/1000):3:(($10-$9)/1000):($3-$3) with vectors
set xrange [0:GPVAL_DATA_X_MAX]
set terminal pdfcairo font 'Arial, 6'
replot
with the output

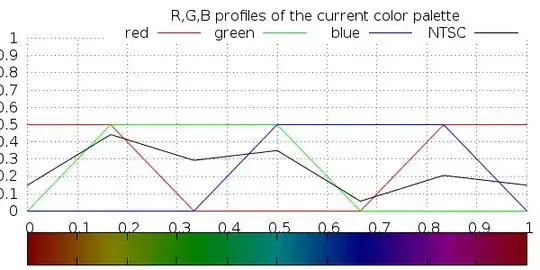
Gnuplot automatically colourized each dataset. The problem is that the contrast is not good, since most of the vectors are in light green and yellow in a white background. Is there a way to change the automatic palette of vectors to darker colors (each color representing one dataset)?